Record Highs Continue…

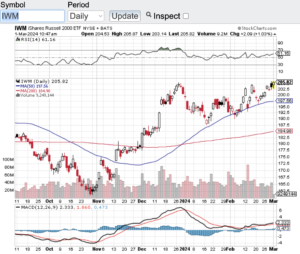
Record highs continue for the Dow Jones Industrial Average (see chart here) and for the S&P 500 (see chart here). In February, the Dow Jones Industrials hit an all-time high of 39282 while for the first time ever, the S&P 500 (see chart here) crossed the 5000 mark trading as high as 5111. These two indexes continue to demonstrate impressive strength along with the Nasdaq Composite (see chart here). It appears that the Nasdaq Composite just might join the Dow Jones Industrials and S&P 500 in hitting a fresh all-time high anytime. The small-cap Russell 2000 (see chart here & below) still has a way to go to reach its all-time high but at least this index is trending up.

Stocks aren’t the only asset class at or near all-time highs, Bitcoin has broken out as of late and has surpassed $60,000 per coin mark. The momentum continues here since Bitcoin ETFs were approved. Now this asset class in not for the faint of heart. As much as Bitcoin continues to rip, sell-offs in this asset class can be dramatic and fast.

So, what is going on with these all-time highs and the “risk on” spirit from institutional investors and retail investors alike? For one, I think the strength of the economy has something do to with this, however, I believe that rampant speculation is also play a role. Especially out of the artificial intelligence sectors as stocks there also continue to make all-time highs. My concern is how long this most recent rally has lasted. For example, the S&P 500 (see chart here) has seen gains in 15 of the last 17 weeks which is rarely seen.

With that being said, as I look at the technical shape of the aforementioned indexes, they are not in overbought territory according to the relative strength index aka the RSI. Many market technicians use this key technical indicator to gage whether a stock or index is overbought. 70 is the key value level of the RSI that would indicate an overbought condition and the major averages are trading below this mark. Now this is only one technical indicator and there are clearly many other factors that determine the state of the markets, but as of now nothing appears to be getting in the way of this impressive months long rally.

Good luck to all 🙂

~George
All Time Highs Continue - Paula Mahfouz

Record Highs For Stocks!

Record highs for stocks are hitting the tape with both the Dow Jones Industrial Average (see chart here) and the S&P 500 (see chart here) hit all time highs yesterday. The Dow Jones Industrial Average hit a high of 38,588 while the S&P 500 traded at 4931 before closing slightly lower. However, the Nasdaq Composite (see chart here) and the Russell 2000 (see chart here) did not hit their all-time highs but the uptrend in those indexes continue.

So why are two of the major averages at all-time highs? For one I think the markets have been anticipating the Federal Reserve to start cutting interest rates this year. However, Fed Chair Jerome Powell yesterday said rate cuts in the near term is not likely. Suffice to say the markets did sell off yesterday after Chair Powell’s remarks. The other factor driving stocks higher is the undeniable strength our economy and the job market. The latest Gross Domestic Product (GDP) report surprised analysts yet again. Economists were expecting the GDP to come in at an annualized growth rate of 1.5%. Instead, the economy grew on an annualized basis of 3.3%. I’d say that’s a beat! The GDP is a measure used to evaluate the strength of the economy. The GDP is the total market value of the final goods and services produced in a given country.

Going forward without question the strength of the economy and job market, along with inflation, will be guiding the Federal Reserve as to the timing of when they will begin to cut rates. Until then, the strength of companies’ earnings results, geo political factors and our own political backdrop should be the catalysts that determine where the markets trade.

Last but not least, the technical backdrop of the key indexes is in decent shape. Yes, the Dow Jones Industrial and the S&P 500 did breach the 70 RSI level briefly but has retreated some since going into overbought territory. All in all, from a technical standpoint, I do not see any alarming trends.

Good luck to all 🙂

~George


The Bounce Was Indeed Real…

In my November 1st blog, I asked the question was the bounce real? Fast forward to today and indeed the bounce the markets experienced in the early fall not only held but took off to and are nearing all-time highs. The Dow Jones Industrials (see chart here) closed yesterday at 36,245, the S&P 500 (see chart here) closed at 4,594 the Nasdaq Composite (see chart here) closed at 14,305 and the small-cap Russell 2000 (see chart here) finished the month out at 1,862.

It’s truly incredible to see how resilient the markets are considering the current interest rate environment and how inflation continues to impact the consumer. Rising interest rates tend to impact the stock market negatively and inflation impacts the consumer negatively too. So why are the markets approaching all-time highs? Could it be that the economy grew at a faster rate in the 3rd quarter than previously reported? Or could it be that the Federal Reserve may be ready to slow down or pause its current interest rate policy? I am not sure on either front, but what is apparent is that the markets are brushing off the current backdrop of Fed’s economic policy and the ongoing inflationary pressures. One thing I have learned over the years is the trend is your friend and these markets continue to trend up.

That being said, let’s look at a key technical indicator that many traders and investors rely on to see if we are approaching or at overbought conditions. According to the Relative Strength Index aka the RSI both the Dow Jones Industrial Average (see chart here) and the S&P 500 (see chart here) have crossed and are trading above the 70 value level. The 70-value level according to the relative strength index is the beginning of overbought conditions. The Nasdaq Composite (see chart here) and the Russell 2000 (see chart here) are fast approaching the 70-value level. I do want to point out that stocks and indexes can remain overbought for extended periods of time, but I would not be surprised if we see somewhat of a pause or possibly a reversal here in the month of December to this very impressive rally we are currently in.

It’s always a good idea to consult a certified financial advisor before making any adjustments to your portfolio. Good luck to all 🙂

~George

Soft Month For Stocks…

August was a soft month for stocks across the board. The Dow Jones Industrial Average (see chart here) closed the month of August down 2.4%, the S&P 500 (see chart here) fell a modest 1.8%, the Nasdaq Composite (see chart here) gave up 2.2% and the small-cap Russell 2000 (see chart here) fell by over 5%. All things considered, not too shabby considering August historically is one of the weakest months of the year for stocks.

The market performance in August did snap a 5-month winning streak for the S&P 500 and the overall volatility in the stocks also picked up some steam. However, I do think the bulls will take such a modest pullback considering how strong the markets had been since early June. It appears some profit taking occurred in August while overall trading volumes were relatively lower. Now that summer is almost behind us, I expect trading volumes to increase along with the possibility of bigger market swings as we head into fall.

Now that we are in September the question becomes can the market weakness in August turn around in September? I typically look for catalysts to see if market direction will turn and as we head into September overall bullish sentiment has decreased. As contrary as this may sound, bullish sentiment decreasing is usually a bullish sign for the markets. I don’t like participating in markets where the sentiment is overly bullish and this has been the case all summer long, especially with how AI stocks went on a tear over the summer. The Artificial Intelligence sector lifted most indexes and if it wasn’t for the AI craze we have witnessed, I am not so sure if the markets would have enjoyed a multi-month bull run.

I always like to look at the technical shape of the markets as another potential catalyst for market moves. There is nothing really standing out either bullish or bearish. From the relative strength index aka the RSI, to where the moving averages are currently positioned, there is nothing too glaring one way or the other. Not a surprise considering how low the trading volumes were in August and the modest pullback that did occur.

Good luck to all 🙂

~George

Is A Soft Landing Ahead?

For months now stock market pundits have been calling for a recession. Now it appears that a soft landing is ahead. You name it from Wall Street analysts to the media, not a day goes by without hearing the word recession. Well folks the economic data that has been coming out lately is showing just how strong our  economy remains. The latest gross domestic product (GDP) report  that was issued last week showed that in the second quarter of this year our economy grew by 2.4% which surprised the street. What’s more is that this the fourth straight quarter of economic expansion. This sure doesn’t sound like a recession to me. Our economy is growing despite the Federal Reserve continuing to raise interest rates. As of now it sure does look like the Federal Reserve is managing these rate hikes to perfection.

The stock market sure likes what it is seeing from the economy. The Dow Jones Industrial Average (see chart here) continues to remain above its recent breakout. The same can be said for the S&P 500 (see chart here), the Nasdaq Composite (see chart here) and the small-cap Russell 2000 (see chart here). As I alluded to in my July blog, it appeared that stocks were on the verge of breaking out. Sure enough, the month of July was a very bullish month not only on the economic front but also for the stock market. One thing I now want to look for now is if stocks are becoming overbought?

As I look at some of the key technical indicators such as the RSI and the Moving Averages technical indicators nothing too alarming there from a technical standpoint. The exception here is both the Dow Jones Industrials (see chart here) and the S&P 500 (see chart here) are flirting with becoming overbought based on the relative strength index aka the RSI. That said, this is no surprise due to how strong the markets performed in month of July. Let’s see if there is a pullback of some sorts here in August or the continuation of this bullish action.

Wishing everyone the best of luck 🙂

~George

Technically Speaking…

The sell-off in the markets accelerated in the month of April and technically speaking it appears there could be more selling pressure ahead. On the year, the Dow Jones Industrial Average (see chart here) is down nearly 10 percent, the S&P 500 (see chart here) is off over 13%, the Nasdaq Composite (see chart here) is down over 21% and the small-cap Russell 2000 (see chart here ) year to date is down 17%.

I am not surprised of the market weakness due to all the factors at play right now. From the war in Ukraine, to the highest inflation rates we have seen in over 40 years, the ongoing Covid backdrop albeit this dynamic appears to be improving and finally, interest rates. The Federal Reserve now has woken up to the fact that this low interest rate environment that we have lived in for over a decade is over. Runaway inflation has now become a major concern for the Fed, and they are now being beyond vocal of their intentions. A 50-basis point increase appears to be the hike here in May and hikes throughout the year are in play. In my view, this is the top catalyst as to the sell-off but let’s keep things in perspective. Last year and previous years for that matter have been a boon for stocks and pretty much every other asset class out there. Record after record have been set for years on asset classes and this is simply not sustainable. A healthy correction is beyond needed and it seems like we are in that mode now!

Now let’s look at the technical shape of the aforementioned key indexes. The Dow Jones Industrial Average (see chart here), the S&P 500 (see chart here), the Nasdaq Composite (see chart here) and the Russell 2000 (see chart here) all closed the month of April out below their key moving averages. The 20-day, 50-day, 100 and 200-day have all been breached while the Relative Strength Index aka the RSI have not yet breached an “oversold” condition. The RSI is a technical “momentum indicator” that has two values of importance. The 70-value level for potential “overbought” conditions and the 30-value level and below is a level that is considered “oversold. All the above indexes are currently hovering around the 35 level. Please remember “technical indicators” are there as a guide and a tool when assessing the technical backdrop of any given stock or index and is not 100 percent perfect.

Good luck to all 🙂

~George


Nowhere Near Raising Rates…

In the words of Fed Chairman Jerome Powell “the Fed is nowhere near considering raising rates”! Last Wednesday the Federal Reserve held its FOMC meeting where it kept interest rates essentially at zero. This despite inflation seemingly everywhere along with a strengthening economy. So, what gives? Without question the most recent spike in Covid cases across our country continues to keep the Fed at bay pertaining to rates. I do get the thinking and strategy; however, I am a bit concerned of inflation overheating and the continuation of record setting asset prices.

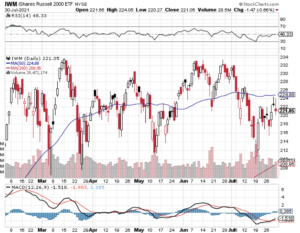
Last week three of the four major averages hit all-time record highs. The Dow Jones Industrial Average (see chart here) hit an all-time high of 35171. On Thursday the S&P 500 (see chart here) notched a record high of 4429 and the Nasdaq Composite (see chart here) booked a record high of 14863. The small-cap Russell 2000 (see chart below) is the one index that is lagging a bit but the uptrend there remains intact.

As mentioned above, I am a bit concerned as to the non-stop record setting ways with asset prices. There seems to be a growing concern on the street about the potential ramifications of easy monetary policies that have been in place for over a decade and counting. There is no question interest rates need to go up and the money printing needs to abate. Yes, we are in a once in a century pandemic and there has been no choice other than to flood the markets with stimulus and support. However, this cannot go on forever.

That said, as I look at the technical shape of the aforementioned key indexes, there are currently no problems there. Three of the four indices that just set records last week all remain above their respective 20-day, 100 and 200-day moving averages. Also, these indexes are not yet overbought according to the relative strength index aka the RSI. So, folks it appears the record setting ways of our markets should continue in the near term. Make sure to always consult with a certified financial advisor(s) before making any decisions and/or adjustments to your investment strategies.

Good luck to all 🙂

~George

Nowhere Near Raising Rates - Paula Mahfouz

Big Tech Blowout!

Big tech steals the show with blowout earnings results. Apple (NasdaqGS: AAPL), Amazon (NasdaqGS: AMZN) and Facebook (NasdaqGS: FB) all took the street by surprise with their upside earnings reports. For Apple, in addition to their blowout earnings, the company announced a 4-1stock split. This was more than enough for Apple to close up over 10% yesterday at an all time high of $425.04. Apple’s earnings came in over $2.00 per share on revenues just shy of $60 billion. Stunning numbers considering the backdrop that our country is currently in. When I look at what Amazon did, I am equally if not more impressed especially with how they grew their revenues. It’s hard to believe a company of this size grew their revenues 40% to almost $90 billion on the quarter. Without question Amazon has benefited more than any other company due to the pandemic. Consumers have flocked to online shopping more now than ever. Last but not least, let’s look at what Facebook did. Despite experiencing ad boycotts by some of the biggest brands in the world, Facebook managed to grow ad revenues by over 10% and grew earnings by almost 100%. I don’t think anyone expected these type of quarterly results from this group with all things considered.

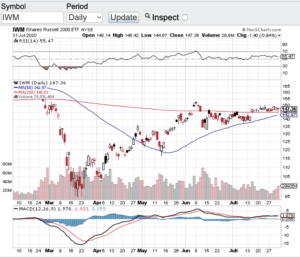
Let’s take a gander at the major averages and how they are looking from a technical standpoint. The Dow Jones Industrial Average (see chart here) closed the week at 26428.32. When I look at the chart of the Dow, this index is not overbought according to the (RSI) and the Dow closed right around its 20-day and 200-day moving averages. The S&P 500 (see chart here) closed at 3271.12 and this index bounced off of its 20-day moving average with perfection. The Nasdaq Composite (see chart here) has been the big winner so far this year and technically speaking this index could potentially keep running. Heck, i’d be ok if it paused and consolidated a bit because of the run its been on. The other index that I keep an eye on is the small-cap Russell 2000 (see chart below). Speaking of consolidation, that is what appears to be happening with the Russell 2000. This index has been trading sideways for the past week or so and is trading consistently above its 20 and 200-day moving averages during this consolidation period. So all in all the aforementioned indexes appear to be on solid ground from a technical analysis standpoint.

In closing, despite the current shape of the market, the month of August historically tends to be a volatile month. Couple this with the upcoming Presidential election and we could be in for a wild ride between now and election day.

Good luck to all 🙂

~George

Big Tech Blowout - Paula Mahfouz

Fear Of A Global Pandemic Grips Markets!

Stocks went into a tailspin as fear of a global pandemic grips the markets! New outbreak clusters of the highly contagious coronavirus are beginning to surface which is pressuring leaders from around the world to act and act more aggressively. Stocks have also entered correction territory as companies and analysts begin to ratchet down their revenue and earning forecasts. Over the past week or so the Dow Jones Industrial Average (see chart here) has lost over 10% in the past week alone, the S&P 500 (see chart here) has also entered into correction mode, the Nasdaq Composite (see chart here) has been hit hard and the small-cap Russell 2000 (see chart here) is also witnessing a sharp sell-off.

Personally I believe a correction was needed because of how robotic the markets have acted. Stocks no matter what risks were out there behaved in a way never before seen. We have been in the strongest bull market ever and nothing over the past 12 years could slow this bull market down. Now I am not happy that it is a global health risk that’s the catalyst to put stocks in correction mode, but nonetheless this is where we find ourselves. Of course when fear is rampant in any market this is where opportunity can be found. I am not suggesting to jump in here because as we all know fear and/or greed can be excessive and markets tend to over do it when emotions take the lead over rational thinking. So when we get overextended to the upside or downside the first thing I look at is how the technicals look during extreme market moves.

When I now look at the technical shape of the markets at least at it pertains to the moving averages things do not look so good. The Dow Jones Industrial Average (see chart here), the S&P 500 (see chart here) and the Russell 2000 (see chart here) have all breached their 20-day, 100-day and 200-day moving averages which are all seen as major support zones especially the 200-day. The Nasdaq Composite (see chart here) is the only major index that has yet to close below its 200-day. That said, all of the aforementioned indexes are oversold according to the relative strength index (RSI) which when we see the 20 value level hit on any stock or index, snap back rallies can and do occur. This type of market is great for traders if you are experienced enough to trade off of technicals, however for investors that have a long term view these type of market environments requires a lot of patience and keeping the emotions at bay. Let’s all hope that the spread of the coronavirus abates and that a vaccine becomes available as quickly as possible.

Good luck to all 🙂

~ George

One Hot June!

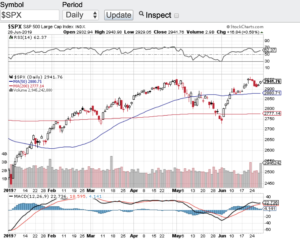
One hot June indeed and I do not mean the weather folks! Stocks and commodities went on a tear in the month of June logging the best June in decades for some of the indexes and other asset classes. The Dow Jones Industrial Average (see chart here) soared over seven percent last month. The S&P 500 (see chart below) hit an all time high in the month of June while both the Nasdaq Composite (see chart here) and the small-cap Russell 2000 (see chart here) notched impressive gains as well. What’s more is both oil and gold surged right along side of the key indexes.

So why the rally? I think the answer is simply an easier monetary posture by the Federal Reserve. It is no secret that inflation is well in check and it is also becoming apparent that the U.S. job market is cooling off. Another factor for the Fed to consider is what impact would a full blown trade war with China do to the U.S. economy? This is why in my opinion we are seeing a continuing upward trend in our markets and that is a dovish Fed is usually very good for stocks. One other factor that will certainly weigh in is the upcoming earnings reporting season. Now that the second quarter of the year is in the books we will see how well corporate America did in Q2 as earnings reporting season gets underway this month. I will continue to look to monitor how “top-line” growth is faring.

Let’s take a quick look at the technical shape of the key indexes. After surging over 7% in June, the Dow Jones Industrial Average (see chart here) remains clearly above its 20-day, 100-day and 200-day moving averages as does the S&P 500 (see chart here). The Nasdaq Composite (see chart here) is in a healthy technical condition and last but not least, the small-cap Russell 2000 (see chart here) has broken above its key moving averages. This is a very good sign for stocks and furthermore none of indices are in overbought territory according to the principles of the RSI also known as the relative strength index.

Both Paula and I wish everyone a very safe and Happy 4th of July holiday 🙂

~George

S&P 500 - Paula Mahfouz