Will Earnings Take The S&P To All Time Highs?

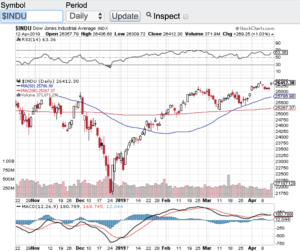
Now that earnings reporting season is upon us, will Q1 corporate earnings take the S&P 500 (see chart here) to all time highs? We are about to find out. For the first time in months the S&P 500 (see chart here) closed above the 2900 mark and is now within striking distance of its record close of 2940 set back in September. Once again the markets feel like they are in melt up mode. The Dow Jones Industrial Average (see chart below) closed on Friday at 26412 just 500 points away from its record high, the Nasdaq Composite (see chart here) is approaching the 8000 level a level it hasn’t seen in months, and last but not least the small-cap Russell 2000 (see chart here) is approaching the 1600 level and trading above its 200-day moving average.

The technical shape of the markets also appear to be healthy heading into Q1 earnings reporting season. All of the aforementioned indexes are trading above their 20-day, 100-day and 200-day moving averages. A good sign. Furthermore, none of these averages are in overbought territory this according the the relative strength index. Yet, another good sign.

Back to Q1 earnings reporting season. Although analysts and market pundits expect corporate earnings to have declined this quarter, I will be paying attention to the guidance that companies give. It’s no secret there has bee a global slowdown lately due to a variety of factors. However, if companies give better than expected guidance, then most likely we should indeed see new record highs.

Companies to look out for this week that are reporting are, Citigroup (NYSE: C), Goldman Sachs (NYSE: GS), Bank of America (NYSE: BAC), Johnson & Johnson (NYSE: JNJ), Netflix (NasdaqGS: NFLX), United Continental Holdings (NasdaqGS: UAL), Abbott Labs (NYSE: ABT), Alcoa (NYSE:AA), Las Vegas Sands, Corp. (NYSE: LVS), PepsiCo, Inc. (NasdaqGS: PEP), American Express (NYSE: AXP) and Honeywell International (NYSE: HON) just to name a few. Let’s see if Q1 earnings reporting season becomes the catalyst for new record highs. Good luck to all 🙂

~George
Dow Jones Industrial Average - Paula Mahfouz


Finally A Market Selloff!

In my last blog, I eluded to a market selloff that just did not happen and I was referring to how stocks typically behave in the August and September. Instead of markets selling off at the end of summer, stocks were setting records. Well the bears got what they had been anticipating over the summer and that is an eye-popping market drop last week. Over the course of two days the Dow Jones Industrial Average (chart) fell over 1300 points. Of course the S&P 500 (chart), the Nasdaq Composite (chart) and the small-cap Russell 2000 (chart) all fell in harmony as well. What’s more these bellwether indexes all breached their 200-day moving averages for the first time in months with the Dow Jones Industrial Average (chart) recapturing and closing above its 200-day on Friday, the Nasdaq Composite (chart) just closed shy of its 200-day, the S&P 500 (chart) literally closed right at its 200-day however, the small-cap Russell 2000 (chart) closed out last week meaningfully below its 200-day moving average looking to find some sort of support. The 200-day moving average is widely regarding by market technicians and institutional investors as a key metric of support and or resistance.

What does all this mean? First, a market that constantly goes up with no retracement to speak of can never be healthy long term. There must be backing and filling along the way so that the risk of a sudden and potentially drastic drop doesn’t occur as what we witnessed last week. I mean c’mon going up in the way that we have over the past decade is not only unheard of but the risk that can come forward from this can spark a nasty correction. I am not suggesting that this will be the case but for the first time since earlier in the year, investors and traders felt the selloff last week.

Earnings reporting season kicks in this week with hundreds of companies set to report. Let’s see if corporate earnings can buoy the market here during this long anticipated selloff. Good luck to all 🙂

George

Traders And Investors Are Awaiting A September Selloff…

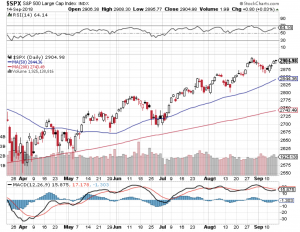
Traders and investors are awaiting a September selloff that actually may not come. Stocks continue to demonstrate strength and resiliency despite the political turmoil in Washington DC, rising interest rates and a seasonality headwind that just isn’t happening. August and September are typically weaker months for the stock market, instead the S&P 500 (see chart below), the Nasdaq Composite (chart) and the small-cap Russell 2000 (chart) hit all-time record highs and the end of August and despite a mini pullback shortly thereafter, the markets appear to have stabilized near all time highs. The Dow Jones Industrial Average (chart) did not make an all-time high in August, however, this index remains within striking distance of its all time high. The pundits are speaking to the strength of corporate America where earnings and profits are at their highest levels in decades as to the reason why the markets are not selling off. What is undeniable is that any time stocks have experienced a pull back it has been met with support from institutional investors and retail investors alike.

Speaking of support, let’s take a closer look at the technical shape of the aforementioned key indexes. Let’s start with the S&P 500 (chart). After pulling back to its 20-day moving average the S&P is right back at a breakout point. Next week we should see if the S&P can indeed breakout or fail and head back to its 20-day. The Nasdaq Composite index (chart) has similar chart pattern although it traded a bit below its 20-day support line for a few days before recapturing its 20-day and is now trading above it. A look at the Russell 2000 (chart), it too closed above its 20-day moving average and last but not least the Dow Jones Industrial Average (chart) also closed above its 20-day and this index is also right at a breakout or breakdown point. These bellwether indexes are also not in an extreme overbought condition according to the Relative Strength Index. The RSI tracks overbought or oversold conditions and is a momentum indicator that measures the degree and velocity of recent price changes to determine what is overbought and what may be oversold. We are simply not in any extreme condition according to the RSI principle.

Let’s see how the back half of September plays out and we will revisit the technical set-up of the markets in October. Good luck to all 🙂

~George

S&P 500 - George Mahfouz Jr


Triple Top Or Breakout?

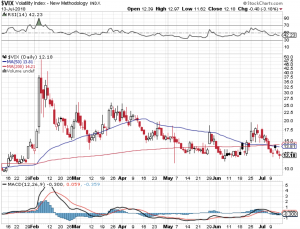
After chopping between the 2700 and 2800 zone for the past couple of months, is the S&P 500 (chart) at a triple top, or is it ready to breakout? I think we are going to find out this week in which second quarter earnings reporting season kicks into high gear. Although volatility has reared its head in first half of 2018, vol now has come back to what the markets have been accustomed to over the past few years (see chart below). Whether we breakout and test all time highs is a head scratcher. Of course earnings will play a key role in which way the markets will go, but there are other market moving factors in the mix. Any minute President Trump could put out a tweet on trade which could kill the most recent rally in stocks or propel it to new highs. On Tuesday and Wednesday, Federal Reserve Chairman Jerome Powell will speak in front of the Senate Banking Committee and the House Financial Services Committee. Without a doubt investors will be paying close attention to the tone and context of Chairman Powell’s testimony in front of both committees. Oh yes, we must not forget the Trump/Putin summit and I can’t even guess what comes out of that meeting and how the markets will react. So as you can see, chance are we will breakout of the triple top we are in or pullback within the trading range as mentioned above.

This week kicks off with high flying Netflix (NasdaqGS:NFLX) which reports their quarterly results tomorrow after the close, followed by Goldman Sachs (NYSE: GS) on Tuesday along with Johnson & Johnson (NYSE: JNJ), T-Mobile (NYSE: TMUS) and rounding the week out we will hear from the likes of Alcoa Corp (NYSE: AA), American Express (NYSE: AXP), eBay Inc. (NasdaqGS: EBAY), International Business Machines (NYSE: IBM), Etrade Financial Corp. (NasdaqGS: ETFC), Intuitive Surgical (NasdaqGS: ISRG), Microsoft Corp. (NasdaqGS: MSFT), General Electric (NYSE: GE) and Honeywell International Inc. (NYSE: HON) just to name a few. Good luck to all 🙂

~George

VIX - George Mahfouz Jr.

Trade War Back On!

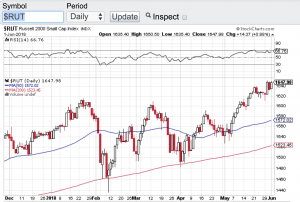
Here we go again, the trade war is back on! Donald Trump yesterday once again fired up the trade war this time including the EU, Mexico and Canada. How is an investor supposed to confidently invest when the message and policies of our government change almost daily. Stocks all week have been whipsawed around which is great for the trader, but no so much for the investor. Now we have countries from around the world retaliating with their own tariffs on our goods. The Dow Jones Industrial Average (chart) finished the week at 24635, the S&P 500 (chart) closed the week out at 2734, the Nasdaq Composite (chart) closed at 7554 and the small-cap Russell 2000 (see chart below) showing its incredible resilience finishing the week out near an all-time high.

The chop action that we are seeing in the markets along with the unpredictably of our government gives me more reason now to focus in on the technical trading patterns of stocks and indices. Whether it is support or resistance levels vis Ă  vis moving averages (click here) i.e. the 20-day, 50-day, 100-day, 200-day or outright overbought or oversold conditions using the Relative Strength Index (click here) or the Bollinger Bands (click here) which can also provide a technical look into extreme conditions. With Q1 earnings reporting season essentially wrapped up, there is no real apparent catalyst to move the markets in a meaningful way. Which is why I will be paying much closer attention to the technical make up of the markets to identify opportunities.

One of my favorites are the moving averages (click here) especially the 200-day moving average. For example, just take a look at the Dow Jones Industrial Average (chart) and the S&P 500 (chart). You’ll see over the past few months each time these indexes gravitated to their respective 200-day MA, they found support and proceeded higher. There is no guarantee that moving averages will always hold and provide support, but in many instances it indeed acts as a short term floor to selling pressure. There are many resources on how technical analysis can work and I would recommend studying the dynamics of TA before including it in your investment or trading strategies. Good luck to all 🙂

~George

Russell 2000 - Paula Mahfouz


Tis The Season…

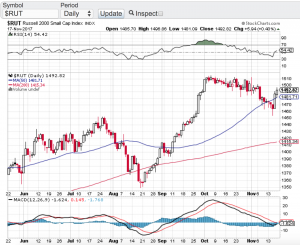
As the holiday season fast approaches stocks have a lot to be jolly for. Despite the recent pop in volatility, the major averages continue to enjoy their record setting ways. The Dow Jones Industrial Average (chart) closed the week at 23,258, the S&P 500 (chart) finished the week at 2,579, the tech focused Nasdaq composite (chart) closed at 6,783 and the small-cap Russell 2000 (see chart below) ended the week at 1,493 while recapturing its 50-day moving average.

Next week is a shortened trading week due to Thanksgiving. Historically the Thanksgiving holiday week tends to be a bullish week for equities with 75 percent of the time the markets finish higher. Add the seasonality factor into the mix and things look pretty good between now and year end. This doesn’t mean that things won’t be choppy along the way especially as the yield curve has many investors paying closer attention to it. Interest rate chatter is seemingly picking up lately despite the Federal Reserve being candid about their position and intentions. This will become further apparent when Fed chair Yellen speaks next week along with the release of the minutes from the last Federal Reserve meeting. All in all it appears that the status quo should be in place between now and year and if this is the case, new market highs should be set.

Earlier I spoke to how the small-cap Russell 2000 ( see chart below) has recaptured its 50-day moving average. This is important from the standpoint that investors and traders alike look to the Russell as a key indicator to the overall health of the broader markets. Recently the Russell has been showing some cracks in its trading patterns including noticeably breaking its 50-day only to recapture it and hold above it a few days later. If you are long this market, this is a bullish sign. That said, I do expect volatility to be present between now and year with the potential of making new highs along the way.

Paula and I wish everyone a very safe and Happy Thanksgiving 🙂

~George

Russell 2000 Paula Mahfouz

Big Time For Big Tech!

Large cap tech stocks have taken center stage this earnings reporting season big time! Absolute blowout earnings reports came in from Amazon (NasdaqGS: AMZN), the parent company of Google, Alphabet (NasdaqGS: GOOGL) and the elders of the group Intel Corp (NasdaqGS: INTC) and Microsoft (NasdaqGS: MSFT). These tech titans are the latest reason for the Nasdaq (chart) and S&P 500 (chart) to reach and close at record highs yet again. The Dow Jones Industrial Average (chart) and the small-cap Russell 2000 (chart) are also within striking distance of their all times highs. Market observers have attributed the strength in stocks this year to a continuing low interest rate environment and the upcoming new tax policy from the Trump administration. This I get, however, no one can deny the growth that is happening in the tech world as well as other sectors of the economy.

The one note of caution I have here is the exuberant environment we find ourselves in with record highs happening weekly and in some instances daily. Yes earnings reporting season so far has been stellar but let’s not forget that we have not seen price to earnings ratios this elevated in quite some time. The question that now comes to mind are the markets and the aforementioned stocks finally at fair value? Especially as the p/e’s increase and as we approach a much higher interest rate environment over the next two years. We have been in such an accommodative monetary state for almost a decade which without a doubt has been the catalyst for equities and indexes and now the federal reserve here in the U.S. is reversing course. One of the groups that get the most affected in a higher interest rate environment are growths stocks like the aforementioned tech titans.

I am not suggesting that these stocks will not continue their upward trajectory, but I am making note and will be paying closer attention to the overall price to earnings ratios of the indexes and of high growth stocks in general as p/e’s continue to elevate. Good luck to all 🙂

~George

No Fear Here…

Despite North Korea launching its seventh missile test of the year on Sunday and the White House seemingly in an upheaval, stocks continue to demonstrate no fear and continue their record setting ways. Today the S&P 500 (chart) and the Nasdaq (chart) hit all time highs. Without question this bull market is now even catching wall street veterans off guard. Q1 earnings reporting season is close to wrapping up and other than retail, most companies have reported in-line or outright beats in their earnings results, especially the tech sector. Tech has been on fire lately and this is due in large part of mega-cap tech smashing analysts expectations. Earnings results from companies such as Apple (NasdaqGS: AAPL), Amazon (NasdaqGS: AMZN), Alphabet (NasdaqGS: GOOGL) and Facebook (NasdaqGS: FB) has propelled the Nasdaq (chart) and these particular issues to all-time highs. The Dow Jones Industrial Average (chart) and the Russell 2000 (chart) remain in striking distance of setting new records as well. It is truly remarkable how the markets have been able to weather the current political environment here in the U.S. and the geopolitical risks abroad.

From a technical perspective, the aforementioned key indices are in pretty good shape. The Nasdaq (chart) is the only one of the four that remains in overbought territory according to the relative strength index. All of these averages also remain above their respective 50-day and 200-day moving averages, yet another bullish sign. Volatility also remains at historic lows. So one may ask what about the “sell in May and go away” adage? From a technical standpoint, I do not see any reason why these markets won’t continue to melt up from here. Of course there is always the risk of a geopolitical event or the actual seasonal risk of assets taking a pause or retracing a bit. That said and whatever the case may be, it is undeniable that the markets have been the most resilient in years, if ever.

Good luck to all 🙂

~George

Geopolitical Risks Abound…

Stocks closed the shortened holiday week down on Thursday as the U.S. dropped the largest non-nuclear bomb on a target in Afghanistan. This just after the U.S. launched tomahawk missiles targeting a Syrian airbase in response to a chemical attack on innocent civilians in Syria. Now North Korea is increasing its verbal threats of an all out war on the United States. What’s going on here? It’s hard to talk about stocks when all of this hatred is occurring around the world. Nonetheless, the markets will move forward but will be certainly affected by the troubling geopolitical environment and the uncertainties that exist in multiple regions around the globe.

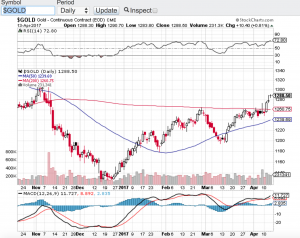
For the week, the Dow Jones Industrial Average (chart) closed down 1%, the S&P 500 (chart) closed off 1.19%, the Nasdaq (chart) -1.2% and the small-cap Russell 2000 (chart) finished the week lower by 1.39%. Gold (see chart below) was up on the week and for the first time since November of last year, closed above its 200-day moving average. This is no surprise due to what is currently going on in the world. The question now is how to trade this market environment or what to do with your current positions? If history repeats itself, market volatility should increase which is good for traders but can be unnerving to longer term investors. In fact volatility (chart) spiked this week to its highest level in 5 months.

Now that earnings reporting season is underway some market pundits are saying that this will dictate whether or not markets will continue higher or if earnings reporting season will be the catalyst to send stocks into correction mode. I disagree with this point of view. How can the markets concentrate on earnings reporting season when you have this widespread turmoil around the globe? Of course, earnings are what typically drive stocks and valuations but until the geopolitical back drop abates and a sense of resolve comes forward I will be ultra conservative in going long any equities unless it is gold or gold related assets. Of course it is always best to consult a certified financial planner(s) before making any investment decisions. Good luck to all and both Paula and I wish all a safe and Happy Easter weekend.

~George

gold chart george mahfouz jr

Solid Gains In Q1!

The major averages closed out the first quarter of the year posting solid results. The Dow Jones Industrial Average (chart) closed up 4.6%, the S&P 500 (chart) closed up 5.5%, the small-cap Russell 2000 (chart) gained 2.1% and the technology focused Nasdaq (chart) finished out the first quarter of the year up an eye-popping 10%. It’s no surprise how well tech did in Q1 considering how much this sector sold off after Trump won the election.

Although stocks continue to outperform, there has been some uncertainty coming into backdrop. The GOP’s inability to pass Trumpcare was the first sign of the potential breakdown of the new administration’s policies. Investors are beginning to wonder whether or not there will be more divide amongst republicans and how that could affect the upcoming tax reform bill. If there are any snags there or if that reform does not pass, some market pundits believe a 10-20% correction could occur.

Here are my thoughts about that. I do agree that if the proposed Trump tax reform does not go through, there indeed could be an immediate market reaction to the downside. How much, who knows? The markets are seemingly priced to perfection and then some. So if corporate tax rates are not reduced as Trump and his administration has outlined, why wouldn’t stocks be affected? Of course we will not know until late summer how the administration’s new tax policy will look like in its final state or whether or not it will even pass.

That said, there is plenty of runway between now and then for stocks and this starts with first quarter earnings reporting season. April is the month in which companies begin to report their earnings results to their shareholders. Corporate profits appear to be growing along with the economy. This my friends is where investors should be valuing stocks. So much emphasis has been put on the new administration’s economic and tax reform policies that we need not to forget about what really matters and that is corporate profits. That is not to say that government polices including the Federal Reserve don’t matter, but at the end of the day and when all the votes are in, growth and profits to me is what truly matters when valuing and investing in stocks.

Good luck to all 🙂

~George