2021 Is Here…

2021 is here and it could not of come fast enough. Happy New Year and I think we can all use a fresh start! The year 2020 was one of the most challenging years our country and the world has faced. One of the only exceptions that did not face many challenges is the stock market. Despite the global pandemic we remain in and the non-stop chaos out of Washington DC, the major averages set record highs throughout the year. Who would of thought that stocks and market speculation would be at such a fever pitch considering the backdrop of 2020. During this latest bull market surge one thing that stands out to me is how margin debt has hit all time highs. Investors have borrowed over $700 billion dollars against their portfolios which is also a new record. This is somewhat alarming because when the market experiences a correction, margin debt can accelerate any meaningful selloff. Some investors could be forced to sell if their margin debt becomes disproportionate to their overall account value. That said, when record highs continue to be set the risk of margin debt tends to be overlooked.

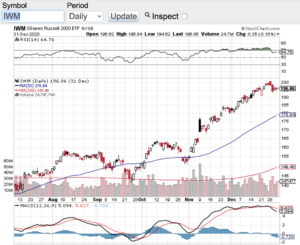
Speaking of record highs, both the Dow Jones Industrial Average (see chart here) and the S&P 500 (see chart here) set new records on the last trading day of the year. The Nasdaq Composite (see chart here) and the Russell 2000 (see chart below) also set records earlier in the week. Although stocks and indexes feel overbought, we are not seeing extreme overbought conditions according the the relative strength index also know as the RSI. There is also support in place at the 20-day, 50-day, 100 and 200-day moving averages. So technically speaking the key indices appear to be in good shape. This set-up bodes well for the continuation of the market rally that we are in.

Of course there are risks out there that could temper the record setting enthusiasm. One risk in particular is the upcoming runoff election in Georgia next week. If the democrats take control of the Senate, this could be viewed as a negative for stocks. The markets historically have liked when there is a split majority between the House and Senate. Pundits argue that a Democratic President and a Democrat controlled Congress could affect income and capital gains taxes that would negatively impact stocks. I am not sure if this will play out but nonetheless as we continue down this bull market path we should not be lullabied to sleep with the risks out there. Good luck to all 🙂

~George
2021 Is Here - Paula Mahfouz

Are Energy Stocks And Banks Cracking?

As technology stocks continue to tick up to new record highs, banks and even more so energy stocks are showing signs of weakness. Yesterday, the Nasdaq (chart) hit an all time high of 6221.99 and the S&P 500 (chart) also notched a record recently at 2418.71. That said, the energy sector has lost almost 10 percent in the last month or so and the banking sector is beginning to technically breakdown. A very noticeable divergence is happening here and I think it is time to pay attention to this recent dynamic. The Dow Jones Industrial Average (chart) remains above 21000 and the small-cap Russell 2000 (chart) is seeking direction.

I am not surprised that certain sectors of the market are showing weakness which is only normal with the tremendous run the markets have had since the election, however, it is the sectors that are breaking down that is a bit alarming to me. One has to ask is the price action in oil and energy stocks indicative of weakening demand hence a weakening economy? Or is this just a matter of too much supply in oil regardless of the O.P.E.C. commitment to its production cuts. As far as the banks are concerned, one would also think with the Federal Reserve raising interest rates at their upcoming meeting in June and committing to additional rate hikes this year. that this would be bullish for bank stocks. Not the case recently. I am a little perplexed to the way the tape has been acting as of late especially pertaining to the aforementioned sectors.

The technical shape of the key indices appear to be intact with the exception of the small-cap Russell 2000. The Dow Jones Industrial Average (chart) is trading well above its 50-day moving average, along with the S&P 500 (chart)  trading near all-time highs and the Nasdaq (chart) as mentioned above hit an all-time high yesterday. However, the small-cap Russell 2000 (chart) is trading below its 50-day moving average and has been challenging certain support zones lately. This is yet another potential alarm along with the energy and banking sector weakness lately. So I would not be surprised to see the selling pressure in these particular sectors continue in the month of June which is historically one of the weakest month of the year for stocks. Good luck to all 🙂

~George

No Fear Here…

Despite North Korea launching its seventh missile test of the year on Sunday and the White House seemingly in an upheaval, stocks continue to demonstrate no fear and continue their record setting ways. Today the S&P 500 (chart) and the Nasdaq (chart) hit all time highs. Without question this bull market is now even catching wall street veterans off guard. Q1 earnings reporting season is close to wrapping up and other than retail, most companies have reported in-line or outright beats in their earnings results, especially the tech sector. Tech has been on fire lately and this is due in large part of mega-cap tech smashing analysts expectations. Earnings results from companies such as Apple (NasdaqGS: AAPL), Amazon (NasdaqGS: AMZN), Alphabet (NasdaqGS: GOOGL) and Facebook (NasdaqGS: FB) has propelled the Nasdaq (chart) and these particular issues to all-time highs. The Dow Jones Industrial Average (chart) and the Russell 2000 (chart) remain in striking distance of setting new records as well. It is truly remarkable how the markets have been able to weather the current political environment here in the U.S. and the geopolitical risks abroad.

From a technical perspective, the aforementioned key indices are in pretty good shape. The Nasdaq (chart) is the only one of the four that remains in overbought territory according to the relative strength index. All of these averages also remain above their respective 50-day and 200-day moving averages, yet another bullish sign. Volatility also remains at historic lows. So one may ask what about the “sell in May and go away” adage? From a technical standpoint, I do not see any reason why these markets won’t continue to melt up from here. Of course there is always the risk of a geopolitical event or the actual seasonal risk of assets taking a pause or retracing a bit. That said and whatever the case may be, it is undeniable that the markets have been the most resilient in years, if ever.

Good luck to all 🙂

~George

Simply On Fire!

Stocks continue to set records and now on a daily basis! As I am writing this blog the Dow Jones Industrial Average (chart) is now trading north of 20440, the S&P 500 (chart) is trading well above 2300, the Nasdaq (chart) is trading above 5750 and the small-cap Russell 2000 (chart) set an all time high yesterday at 1398! I continue to be amazed on how resilient the markets have been and continue to be. Earlier this month it appeared that the Trump rally stalled out and it was becoming a wait and see environment. Well now the Trump rally has seemingly reignited. Trump last week announced he has major news forthcoming on his tax plan and that was apparently the cue for the markets to rally yet again. However, one has to ask how many more tweets, news conferences or headlines can take the markets higher? Without question the above key indices are becoming overbought and especially pertaining to the relative strength index also know as the RSI. Let’s take a look.

Currently the Dow Jones Industrial Average’s RSI (chart) is trading at a 73, the S&P 500 (chart) RSI is also currently at 73, the Nasdaq (chart) is even higher at 77. The only laggard pertaining to the relative strength index and being in an “overbought” condition is small-cap Russell 2000 (chart) in which its RSI is currently at the 60 value level. Remember the relative strength index is a widely utilized technical indicator that certain institutional traders include in their models along with a variety of algorithm trading platforms. The RSI is a momentum indicator that tracks the size of gains and losses over a given period of time with the 70 value level and above as overbought and the 30 value level and below as oversold. One of the concerns certain market technicians have is that these all time highs and overbought conditions have been occurring on relatively light volume. Without trying to call a top here, I suspect that the aforementioned indices and some of the overbought stocks within these indexes are due for a pullback.

Good luck to all and Paula and I wish everyone a Happy Valentine’s Day 🙂

~George


A Spooky Time For Stocks?

As Halloween fast approaches is this also a spooky time for stocks? Without question volatility has picked back up which to me is no surprise at all. Factor in all of the headlines out of Europe, earnings reporting season here at home and last but not least, the daily Hillary Clinton and Donald Trump show. It’s no wonder stocks are bouncing around all over the place. For the week, the Dow Jones Industrial Average (chart) closed lower by one half of one percent, the Nasdaq (chart) closed off by 1.5%, the S&P 500 (chart) -1.0% and the small-cap Russell 2000 (chart) lead the pack and finished the week lower by 2%. With all of the headlines and headwinds for that matter, I still remain quite impressed by the resiliency of stocks despite facing a multitude of uncertainties.

This upcoming week should also be a doozy as earnings reporting season kicks into high gear. Starting off the week, Bank of America (NYSE: BAC) will release their quarterly results followed by International Business Machine (NYSE: IBM), Goldman Sachs (NYSE: GS), Intel Corp (NasdaqGS: INTC), Johnson & Johnson (NYSE: JNJ), American Express (NYSE: AXP), Ebay (NasdaqGS: EBAY), Morgan Stanley (NYSE: MS), American Airlines (NasdaqGS: AAL), Microsoft Corp (NasdaqGS: MSFT), Paypal Holdings (NasdaqGS: PYPL), Verizon Communications (NYSE: VZ), General Electric (NYSE: GE), Honeywell (NYSE: HON) and McDonald’s Corp just to name a few. Expectations for this earnings reporting season is subdued and any upside surprise could bode well for sentiment during these volatile times.

Let’s take a quick look at the technical shape of the aforementioned indices and all but the small-cap Russell 2000 appear to be finding support either at their 50-day or 20-day moving averages.  The small-cap Russell 2000 (chart) does appear to be breaking down at an accelerated rate however, it does appear that the 1200 level of the Russell 2000 should be met with a bit of support.

Both Paula and I wish everyone a very safe and Happy Halloween and good luck to all. 🙂

~George


First Quarter In The Books…

Q1 proved to be a mixed bag for the major averages. The Dow Jones Industrial Average (chart) closed out the first quarter up almost 1.5%, the S&P 500 (chart) finished up 0.77%, however, both the Nasdaq (chart) and the small-cap Russell 2000 (chart) finished out the first quarter of the year lower by 2.75% and 1.78% respectively. Not too shabby considering these key indices were down over 10% earlier in the quarter. This morning stocks are lower despite a stronger than expected  jobs report. In March, the economy added 215,000 jobs with the unemployment rate now at 5%.

With Q1 in the rear view mirror all attention will now be focused on first quarter earnings reporting season. The Commerce Department recently issued a report indicating that corporate profits were down 15% year-over-year. This does not bode well for stocks when the current p/e ratio’s of the major averages are well above their historic averages. With earnings reporting season just ahead, we will not have to wait too much longer to see how well corporate America is doing.

Let’s take a quick look at the technical shape of the markets. Most of the key indices are at or near overbought conditions, which has been the case for pretty much most of March. In my previous blog I eluded to what most market technicians look at when gauging overbought or oversold conditions. Furthermore and technically speaking, the major averages are all trading at or above their 20, 50 and 200-day moving averages with only the small-cap Russell 2000 (chart) chasing its 200-day. If you are bullish on the market, these moving average patterns are typically a good thing. That said, I do expect volatility to pick up a bit which is usually the case ahead of earnings reporting season. I will check back in mid-month or so to see how earnings growth actually appears.

Good luck to all 🙂

~George

Is It A Looming Rate Hike, Or Something Else?

After posting blistering gains in the month of October, stocks took it on the chin last week and it’s technically looking like more short-term downside could be in the cards. For the week, the Dow Jones Industrial Average (chart) lost 665 points, the Nasdaq (chart) retraced 219 points or 4.3%, the S&P 500 (chart) -76 points and the small-cap Russell 2000 (chart) closed lower on the week by 53 points or 4.4%.

Seemingly, the start of the selling pressure accelerated when the October labor report came out surprisingly strong. This report was released on November 6th. One could say that this is the main reason stocks have been under pressure. Pundits are now calling with almost certainty that the Federal Reserve has the green light to raise interest rates at their next meeting in December. Couple this will commodity prices continuing to fall, in particular oil, which is down recently almost 10% and you can understand why the markets would be under pressure. Or could it be the simple fact that October saw almost 10% gains across the board and the key indices were overdue for a pullback. I’d like to add to the mix that the latest round of economic numbers could also be weighing in on investor sentiment. This is evidenced by a weaker than expected retail sales number and weak retail earnings reports issued last week along with a very weak Producer Price Index. Sum all of this up and it’s no wonder the aforementioned indexes closed lower by almost five percent last week. From a technical perspective the key indexes have now breached their respective 200-day moving averages and if you are bullish, you would want to see the markets recapture this key technical support line and return to the uptrend that was intact throughout the month of October.

As the Thanksgiving Day holiday fast approaches, both Paula and I wish everyone a very safe, healthy and Happy Thanksgiving 🙂

~George

Q1 Ends With A Bang!

Stocks closed out the first quarter of the year down impressively. The Dow Jones Industrial Average (chart) closed down 200.19 points, the Nasdaq (chart) -46.55, the S&P 500 (chart) -18.35 and the small-cap Russell 2000 (chart) finished the day down 5.03 points. The Dow Jones Industrials (chart) also finished the quarter slightly in the red, while the other aforementioned indices eked out modest gains.

Looking ahead to Q2, I suspect that we will be in for a very volatile and choppy market. As the first quarter was winding down we were experiencing triple digit swings on the Dow, as well as spikes in volatility across the board. Now I am beginning to think we will even see more volatility come into the market. April historically is a strong month for stocks, but we find ourselves entering into Q1 earnings reporting season in which I think corporate America may see widespread earnings declines. This is due in large part to how strong the U.S. dollar (chart) has been and how this will affect a wide array of multi-national companies who generate meaningful revenues overseas. A strong dollar does not bode well for U.S. companies with this type of earnings profile. Of course not all U.S. companies rely on overseas revenue and I would also think that certain technology and healthcare companies will do just fine.

The one sector I will be paying the closest attention to this upcoming earnings reporting season is the energy sector. Oil (chart) has been taken out to the woodshed since last fall as well as the majority of oil related stocks. So with the price of oil plunging as it has, earnings out of this sector should be horrific. However, these are the times when rare opportunities can and do present themselves. I will look for “washout” moments with certain oil related stocks after they report their earnings to step in and start building positions. I would expect most of the bad news in this sector is about to be released, hence, a set-up for the right buying opportunity. Of course, I will be looking for companies with pristine balances sheets, with minimal to no debt and have those companies at the top of my list. That said, before you make any investments in any sectors, make sure that you consult with a trusted and certified financial advisor(s) to understand the risks associated with stocks, commodities and the like. Also note, this is a holiday shortened trading week due to Good Friday and both Paula and I wish everyone a very safe and happy holiday weekend 🙂

~George

First Half Of The Year In The Books, And The Bull Keeps Running…

After gaining 30% or so in 2013, the markets continue to be on one of the most impressive bull runs in modern history. Here is how the four key indices closed out the first half of 2014: The Dow Jones Industrial Average (chart) finished up 1.5%, the Nasdaq (chart) gained 5.5%, the S&P 500 (chart) advanced 6.1% and the small-cap Russell 2000 (chart) closed out the first half of 2014 up 2.6%. Looking back to the market lows of early 2009, these aforementioned indices have tripled or better in price, which is simply stunning.

I think now is as good a time than any to begin to take a look at how the major averages can continue to rise in spite of almost tripling over the past 5 1/2 years. What could be the catalyst(s) going forward? It’s no secret that the Federal Reserve is scaling back its asset purchases and are scheduled to be finished by year-end, so no surprise there. This in fact is where the bear camp is growling that the end of the Fed stimulus program could be the catalyst to end this historic bull run. What about corporate earnings? In my humble opinion, herein lies the single most important catalyst that will either add fuel to this incessant bull run or put the brakes on it. If it’s the latter, this could also create the first real correction in stocks, something that hasn’t occurred in years.

Investors will not have to wait too much longer for Q2 earnings reporting season is upon us. The first key earnings release that has economic implications will be Alcoa (NYSE: AA) which is due to report next Tuesday after the close. I will be very interested to see the top-line growth of Alcoa which will certainly shed some light as to the health of the global economy. Investors have been bidding up Alcoa most of the year in anticipation of an expanding global backdrop. Another economically sensitive stock at least as it pertains to the consumer is Family Dollar Stores (NSYE: FDO). Family Dollar is scheduled to report their quarterly results next Thursday before the market opens. Then by mid-July we will be in high gear to hear how corporate america fared in Q2. The week of July 14th, earnings are scheduled to come out of American Airlines (NYSE: AAL), American Express (NYSE: AXP), Blackrock ( NYSE: BLK), Citigroup (NYSE: C), Whirlpool Corp (NYSE: WHR), JPMorgan Chase (NYSE: JPM) Goldman Sachs (NYSE: GS), Johnson & Johnson (NYSE: JNJ), Intel (NasdaqGS: INTC), Yahoo (NasdaqGS: YHOO), Bank of America Corp (NYSE: BAC), Ebay (NasdaqGS: EBAY), U.S. Bancorp (NYSE: USB), Yum Brands (NYSE: YUM), Baker Hughes Inc (NYSE: BHI), UnitedHealth Group (NYSE: UNH),  Blackstone Group LP (NYSE: BX), International Business Machine (NYSE: IBM), Google (NasdaqGS: GOOGL), Bank of New York Mellon Corp (NYSE: BK) and General Electric (NYSE: GE) just to name a few. As you can see, I think it is safe to say that by the middle of July or so we will have a pretty good idea of how corporate America is faring.

Please note that in recognition of the 4th of July holiday, the markets will be closing at 1pm E.S.T. on Thursday and is closed on Friday the 4th. Both Paula and I wish everyone a very safe and happy 4th of July 🙂

~George


Stocks and Indexes Continue to Set Records!

The month of October proved to be yet another record setter with a number of stocks from a variety of sectors hitting all time highs and the S&P 500 (chart) setting a new record high of 1775.22 on Wednesday. The Dow Jones Industrial Average (chart), the Nasdaq (chart) and the small-cap Russell 2000 (chart) all hit 52 week highs as well on Wednesday. This seemingly unstoppable bull run is unprecedented with gains of over 20% on most of the key indices year to date. I think it is fair to say a pause is overdue and would most likely be very healthy for the overall market.

In last month’s opening blog, I discussed how selling options premium can be beneficial in times of increased volatility, and in particular the “covered call” strategy. Today I would like to cover “selling puts” as a way to create options premium income. Unlike the “covered call” strategy where you must own the underlying security in order to “write or sell” a covered call, selling a put does not require you to own the security. However, by selling a put, you are potentially obligated to purchase the security should it close below the strike price you chose on its expiration day.

Let’s look at an example of selling a put on a given stock and like last month I will use Facebook (NasdaqGS: FB) as the example. Facebook is currently trading around $50 dollars a share. In looking at the options chain on Facebook and its current pricing, the December $48 puts are bidding around $2.00 dollars per contract. If an investor were to sell 10 December $48 dollar puts on Facebook for $2.00 per contract, that investor would bring in $2,000 dollars in premium less transactions costs. If Facebook closes above $48.00 dollars a share on expiration Friday in December, the investor would keep the entire premium he collected. However, by selling the 10 put option contracts, the investor has the obligation to purchase 1000 shares of Facebook should Facebook close below $48.00 per share on expiration Friday in December. It’s important to note that before considering and implementing a “selling put” strategy you must be willing to own the stock at the strike price you sold the puts on and in this Facebook example, that would be $48.00. However, your cost basis would not be $48.00 because you received $2.00 in premium when you sold the puts, therefore, your cost basis would be $46.00 per share less transactions costs.

Please also note this is not a recommendation to sell puts on Facebook or any other asset or index. This is merely another example of how an investor can capitalize on selling options premium. In closing and as I always suggest, please consult with a certified financial planner(s) before making any investment decisions.

Have a great weekend 🙂

~George