Trying To Make Up Its Mind!

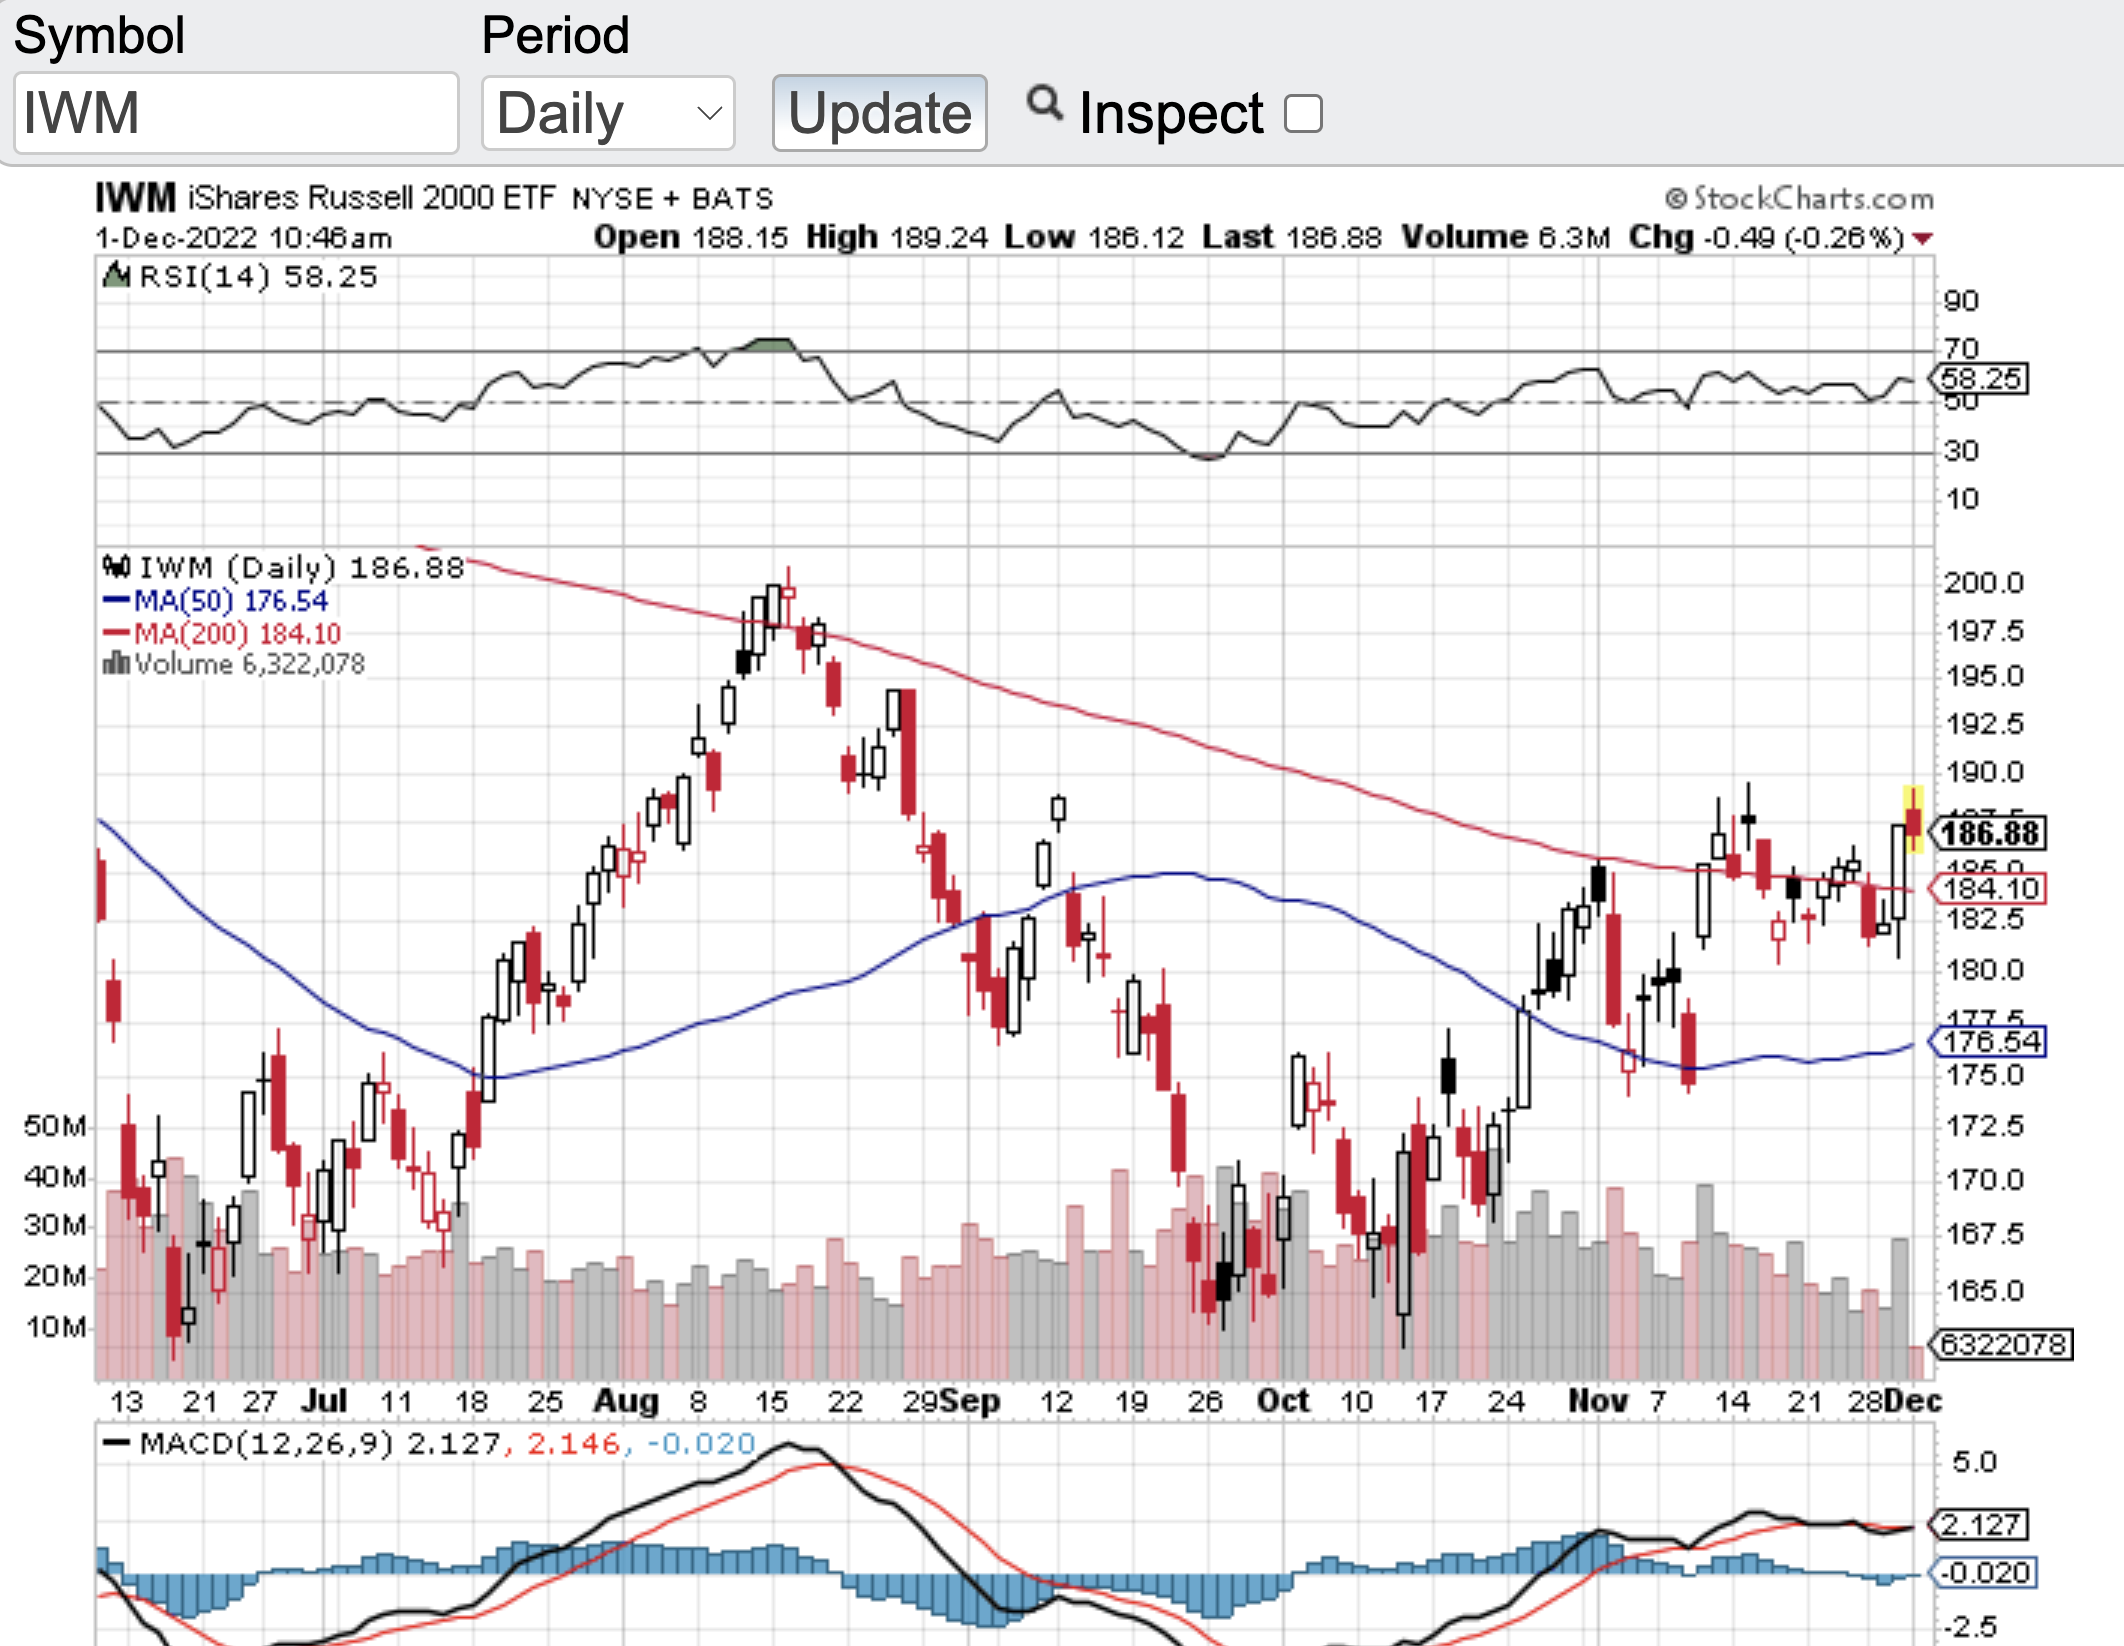
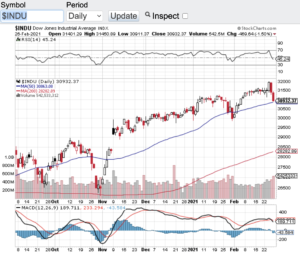
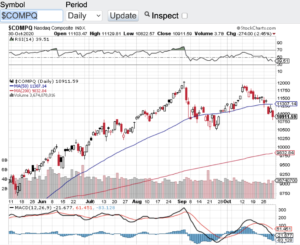
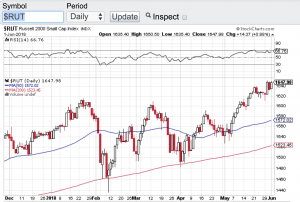
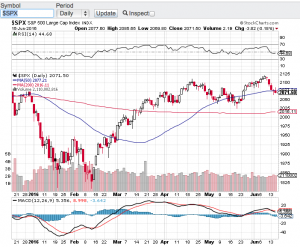
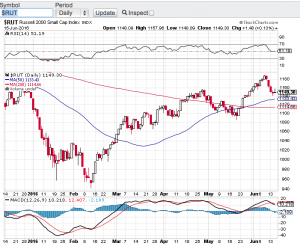
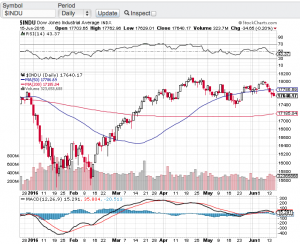
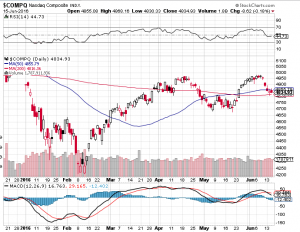
Seemingly, the markets are trying to make up their mind on whether to breakout or breakdown. Over the past couple weeks, the Dow Jones Industrial Average (see chart here), the S&P 500 (see chart here), the Nasdaq Composite (see chart here) and the small-cap Russell 2000 (see chart here and below) have all been consolidating in a very tight trading range. As you can see in the charts of these major averages, consolidation has occurred while also finding support at their 100 and 200-day moving averages. These tight trading ranges along with moving average support bodes well for an inevitable break from this current trading range . The question is will the markets breakout before year end or breakdown and through their respective moving averages support lines?

Let’s face it, we are currently in a bear market and rightfully so. It has been repulsive to see how inflated asset prices were during the heart of the pandemic. Stimulus was abound, interest rates remained at all-time lows and then speculation went from reasonable to very disturbing. This recipe set up the bear market and then Federal Reserve launched it by aggressively raising interest rates. My comment to that is what took them so long? The Fed had no choice to but to start raising rates and inflation took off to levels not seen in over 40 years. The silver lining to all the above is that finally we are moving towards a market that is now more trustworthy. Trustworthy from the standpoint that stocks may actually start trading at reasonable levels to where opportunities can be found. In fact, it is possible that certain stocks and sectors for that matter will overshoot to the downside to where great opportunities could come to the forefront.

As mentioned above, stocks are currently trading in a tight trading range and have support at their moving averages. However, with year-end approaching and as traders and investors reposition their portfolios I would not be surprised if we exit this tight trading range the markets have been in.

Good luck to all 🙂

~George

Does It Feel A Bit Bubbly?

Do the markets feel a bit bubbly to you? This question is beginning to surface more frequently lately and I think it’s a great question to be asking. The majority of asset classes seemingly have gone straight up without pause over the past several months. Whether it’s the stock market as a whole, the crypto space or one of the hottest trends lately are SPAC’s. What is a SPAC? A SPAC is a special purpose acquisition vehicle that is publicly traded but has no assets other than cash. These vehicles are specifically designed to form as a public company, raise capital and then seek out companies to acquire. For example the electric vehicle space has been one of the favorite sectors for SPAC’s to target over the past year. This is a much easier pathway for private companies to go public without having to go through the time and expense of a traditional IPO.

One of the problems that is happening with the SPAC trade is once they identify a target and move to acquire it, the valuations of these SPAC’s begin to rise steadily into the nosebleed section of the markets. So much speculation is occurring with these SPAC’s institutional and retail investors are willing to pay essentially any price to get on board. Let’s not forget about the day traders that add fuel to the rise in these SPAC’s. So between all of the above and now with interest rates starting to tick up, it’s now wonder we have witnessed over a 1000 point drop in the Dow Jones Industrial Average (see chart here) to close out last week. Now let’s look at the technical shape of the major averages.

The Dow Jones Industrial Average (see chart below), the S&P 500 (see chart here), the Nasdaq Composite (see chart here) and the small-cap Russell 2000 (see chart here) over the past few trading sessions have all dropped below their respective 20-day moving averages and are finding support at their 50-day. Let’s see if these key indices can hold their 50-day moving average support zone this week. If they can the uptrend could very well remain intact, if not, we could see late last weeks selling pressure continue.

Good luck to all 🙂

~George

Does It Feel Bubbly? - Paula Mahfouz

Two Days To Go…

It’s two days to go before our country’s Presidential election takes place. I think most everyone now is exhausted by the process. How many more commercials can be displayed? How many more rallies can we take? What’s more is I think we have all had enough of the bashing and trashing that is going on and quite honestly this type of behavior is unbecoming of our great nation. Thank goodness this is almost over.

What has impressed me the most is how the markets have held up especially with all that is going on in our country. Yes, over the past couple of weeks the major averages have had a noticeable pullback. However, with the election at the forefront of everyone’s minds and the pandemic reaching all time highs, I have to ask myself why haven’t we seen a 20% or more correction? Instead we find ourselves in the midst of a 7-8% pullback. One of the answers very well may be how the averages are responding to their key technical support levels. Let’s first look at the Dow Jones Industrial Average (see chart here). On Friday, the Dow Jones on a intraday basis temporarily breached its 200-day moving average which is at the 26263 level. Then this bellwether average bounced sharply off of its support to close at 26501. Time and time again we have seen how important key support levels are to the markets and this was text book action pertaining to support levels at work. Friday was the perfect intraday response in how the Dow Jones Industrial Average responded to its 200-day moving average.

Now let’s take a look at the Nasdaq Composite (see chart below). On Friday, the Nasdaq essentially closed right at its 100-day moving average. So we will see this week whether or not this particular support line holds true to form. There are instances to where I have seen support levels breached for a few days or so and then respond. Whatever the case is, I am impressed with how the overall markets have weathered the backdrop of the current environment we find ourselves in.

Good luck to all 🙂

~George

Two Days To Go - Paula Mahfouz


The 200-Day Moving Average Holds!

The 200-day moving average held its ground despite the constant tape bombs and tweets that continues to come out of Washington. It is no secret that stocks have been on a wild ride over the past few weeks from making all-time highs to rip roaring selloffs. The continuation of tariff threats out of Washington has been a huge catalyst for the increase in volatility in stocks. That said, with all of the madness that is swirling around the Dow Jones Industrial Average (see chart here), the S&P 500 (see chart here) and the Nasdaq Composite (see chart here) have all managed to stay above their respective 200-day moving averages. This key technical support line has held true to form during these market selloffs. The small-cap Russell 2000 (see chart here) has not been as fortunate and could not hold its 200-day.

So in addition to the Washington D.C. threats of additional tariffs, the markets also had to deal with the dreaded 10-year and 2-year yield curve inverting. Whenever longer term interest rates fall below shorter term interest rates in the bond market that historically is a signal that a recession might be looming. Now there is a meaningful lag here whenever we see the yield curve inverting, so as long as the curve flattens out and returns to a normalized dynamic, we should escape the threat. However, if the yield curve remains inverted for an extended period of time then we could be in for something else.

Let’s get back to the technical shape of the markets. As mentioned, three of the four major averages held above their respective 200-day moving average support line which is a good thing technically. What also helped is during these meaningful selloffs is that the markets did go into oversold territory and technically bounced. Let’s see how the next couple of weeks shape up as we wind down the dog days of summer.

Good luck to all 🙂

~George

Trade War Back On!

Here we go again, the trade war is back on! Donald Trump yesterday once again fired up the trade war this time including the EU, Mexico and Canada. How is an investor supposed to confidently invest when the message and policies of our government change almost daily. Stocks all week have been whipsawed around which is great for the trader, but no so much for the investor. Now we have countries from around the world retaliating with their own tariffs on our goods. The Dow Jones Industrial Average (chart) finished the week at 24635, the S&P 500 (chart) closed the week out at 2734, the Nasdaq Composite (chart) closed at 7554 and the small-cap Russell 2000 (see chart below) showing its incredible resilience finishing the week out near an all-time high.

The chop action that we are seeing in the markets along with the unpredictably of our government gives me more reason now to focus in on the technical trading patterns of stocks and indices. Whether it is support or resistance levels vis à vis moving averages (click here) i.e. the 20-day, 50-day, 100-day, 200-day or outright overbought or oversold conditions using the Relative Strength Index (click here) or the Bollinger Bands (click here) which can also provide a technical look into extreme conditions. With Q1 earnings reporting season essentially wrapped up, there is no real apparent catalyst to move the markets in a meaningful way. Which is why I will be paying much closer attention to the technical make up of the markets to identify opportunities.

One of my favorites are the moving averages (click here) especially the 200-day moving average. For example, just take a look at the Dow Jones Industrial Average (chart) and the S&P 500 (chart). You’ll see over the past few months each time these indexes gravitated to their respective 200-day MA, they found support and proceeded higher. There is no guarantee that moving averages will always hold and provide support, but in many instances it indeed acts as a short term floor to selling pressure. There are many resources on how technical analysis can work and I would recommend studying the dynamics of TA before including it in your investment or trading strategies. Good luck to all 🙂

~George

Russell 2000 - Paula Mahfouz


A Spooky Time For Stocks?

As Halloween fast approaches is this also a spooky time for stocks? Without question volatility has picked back up which to me is no surprise at all. Factor in all of the headlines out of Europe, earnings reporting season here at home and last but not least, the daily Hillary Clinton and Donald Trump show. It’s no wonder stocks are bouncing around all over the place. For the week, the Dow Jones Industrial Average (chart) closed lower by one half of one percent, the Nasdaq (chart) closed off by 1.5%, the S&P 500 (chart) -1.0% and the small-cap Russell 2000 (chart) lead the pack and finished the week lower by 2%. With all of the headlines and headwinds for that matter, I still remain quite impressed by the resiliency of stocks despite facing a multitude of uncertainties.

This upcoming week should also be a doozy as earnings reporting season kicks into high gear. Starting off the week, Bank of America (NYSE: BAC) will release their quarterly results followed by International Business Machine (NYSE: IBM), Goldman Sachs (NYSE: GS), Intel Corp (NasdaqGS: INTC), Johnson & Johnson (NYSE: JNJ), American Express (NYSE: AXP), Ebay (NasdaqGS: EBAY), Morgan Stanley (NYSE: MS), American Airlines (NasdaqGS: AAL), Microsoft Corp (NasdaqGS: MSFT), Paypal Holdings (NasdaqGS: PYPL), Verizon Communications (NYSE: VZ), General Electric (NYSE: GE), Honeywell (NYSE: HON) and McDonald’s Corp just to name a few. Expectations for this earnings reporting season is subdued and any upside surprise could bode well for sentiment during these volatile times.

Let’s take a quick look at the technical shape of the aforementioned indices and all but the small-cap Russell 2000 appear to be finding support either at their 50-day or 20-day moving averages.  The small-cap Russell 2000 (chart) does appear to be breaking down at an accelerated rate however, it does appear that the 1200 level of the Russell 2000 should be met with a bit of support.

Both Paula and I wish everyone a very safe and Happy Halloween and good luck to all. 🙂

~George


Looks Like A Double Top…

A recent attempt to breakout to all-time highs has seemingly failed. The Dow Jones Industrial Average (see chart below) , the tech-focused Nasdaq (see chart below), the S&P 500 (see chart below) and the small-cap Russell 2000 (see chart below) all appear to have “double topped” and have retreated to support lines. Without question growth concerns here in the United States are abound. These concerns escalated right after the release of May jobs report which was dismal to say the least. Couple these concerns with the potential of the United Kingdom leaving the European Union and its no wonder why the markets have pulled back over the past couple of weeks.

One of the risks to the markets that I highlighted in my last blog were interest rates. It appeared at the beginning of the month that the Federal Reserve and market pundits were all but certain that a rate hike would occur at today’s Federal Reserve meeting. Well thanks to the underwhelming May jobs report, no rate hike occurred this month and furthermore the Federal Reserve have lowered their outlook for any near term future increases! The Fed did say that they will be monitoring our economy and the data to guide them in their future policy decisions and sure enough they continue to stand by this protocol.

Now what? First for me, I want to see how the market reacts to next Thursday’s vote as to whether or not Britain leaves the European Union? Momentum does appear to be increasing for a British exit, which could lead to a global slowdown? Nobody knows if the referendum will pass or what type of effect this will have across the pond or here in the U.S. In the meantime, I will be monitoring the technical shape of our key indices and as you can see in the below charts each of these indexes have found support at either the 20-day, 50-day or 200-day moving averages.

Good luck to all 🙂

~George Mahfouz, Jr.

george mahfouz jr SPX chart

george mahfouz, jr Russell chart


george mahfouz jr Dow chart

george mahfouz jr nasdaq chart

Stocks Are Back!

Since losing over 10 percent of their values and going into correction territory earlier this year, the major averages now find themselves almost back to par. Year-to-date the Dow Jones Industrial Average (chart)  is only down around one percent, the S&P 500 (chart) is also lower by around one percent, the Nasdaq (chart) on the year has gained back over half of its losses and the small-cap Russell 2000 (chart) is lower by 4.5%. Since this bull market began over seven years ago, time and time again stocks have demonstrated astounding resilience. Seemingly every time there is a sell-off, willing buyers are ready to step in at varying support levels and buy up equities.

Today the Federal Reserve left interest rates unchanged and actually slashed their forecast to project only two additional rate hikes for the rest of this year versus the four rate hikes they had originally targeted. Stocks initially popped on the news and only one can conclude that the continuing accommodating monetary policies not only here in the United States, but from around the world is most likely the reason why this seven year bull market continues.

That said, the aforementioned indices are approaching overbought conditions according to the relative strength index. Remember the RSI is one of the favorite technical indicators by market technicians, certain algorithmic programs and institutional investors alike. The relative strength index measures and compares the size of moves in a selected period of time and according to the RSI, the 70 or greater value level signals an overbought condition and the 30 value level or lower indicates an oversold condition. Keep in mind stocks and/or indexes can remain overbought or for that matter oversold for an extended period of time. Currently the Dow Jones Industrial Average (chart) is almost touching the 70 value level and the other indexes are not too far behind. Of course this is only one of many technical indicators that traders and investors utilize, but I have found over the years the RSI is one of the more reliable indicators out there.

Good luck to all 🙂

~George

Happy New Year!

The bull run continues for the stock market which posted yet another year of gains in 2014. However, not quite the eye-popping 30% performance that the major averages experienced in 2013. Nonetheless, in 2014 the Dow Jones Industrial Average (chart) gained 7.52%, the Nasdaq (chart) advanced 13.4%, the S&P 500 (chart) gained 11.39% and the small-cap Russell 2000 (chart) finished the year up a modest 3.52%.

Looking ahead to 2015, simply put, if the Federal Reserve stands pat and does not raise interest rates, stocks here in the U.S. should continue to head north. Of course should the U.S. economy continue to expand and the job market continue to improve, we should begin to see rates inch up, which could possibly slow this six-year bull market down. I think the velocity of any rate increases will be the main factor as to how the markets would react. A slow and steady course should not disrupt stocks too much, however, if the fed surprises the street by raising rates too aggressively, then we could be in for a very volatile year. Whatever the case is, I also believe in 2015 the street will be looking more closely to the top-line growth of corporate America in order to justify the lofty average P/E ratio of S&P 500 companies. The current P/E ratio of the S&P is around 18 compared to the historic average of around 15.

Let’s now take a look at the current technical set-up of the aforementioned indices. The Dow Jones Industrial Average (chart), the Nasdaq (chart), the S&P 500 (chart) and the small-cap Russell 2000 (chart) all remain below the 70 value level of the relative strength index (RSI) The 70 value level of the RSI is considered overbought territory. In addition, these indexes are also trading above their 20, 50 and 200-day moving averages which is considered support zones of this particular technical indicator, especially the 200-day moving average. So technically speaking, stocks appear to be on solid footing heading into 2015. That said, Paula and I wish everyone a very safe, prosperous and Happy New Year 🙂

Sincerely,

~George


Not Even The Dog Days Of Summer Can Slow Down This Bull!

Stocks once again defied logic setting records in the month of August, which is typically a soft month for equities. For the month, the Dow Jones Industrial Average (chart) finished up 3.2%, the tech-heavy Nasdaq (chart) closed the month up 4.8%, the S&P 500 (chart) gained 3.8% and the small-cap Russell 2000 (chart) closed the month up 4.85%. Now granted these gains came on relatively low volume, but nonetheless a very impressive performance considering the macro environment we are in especially with the geopolitical concerns in the middle-east and Ukraine. I suppose the U.S. economic numbers that have come out recently is part of the reason why stocks continue to march north. Last Thursday the Commerce Department revised the second quarter U.S. gross domestic product (G.D.P.) number to 4.2% which is quite a healthy expansion of our economy and what’s more, the sources of growth were broad based.

Looking ahead to this month, when traders and investors come back from their summer vacations, they will see all time highs for the S&P 500 (chart), the Dow Jones Industrial Average (chart) and don’t look now, even the Nasdaq (chart) is slowly approaching the 5000 mark, a mark that has not been seen since the tech-bubble of 2000. If you have been bearish or short this market, I do not know what to say other than I feel your pain. We have not had a 10% correction in equities in years now and just the slightest of pullbacks have been met with incessant support. I do not know what is going to break this trend and you know what they say, “the trend is your friend”. Enough of that, seriously, I too have been expecting at least a 5-10% correction, which if you are bullish, you should welcome it. Not only would this be healthy for the markets, in my view it’s getting to the point to where it’s almost required. I am beginning to become a little concerned that should a “black-swan” event occur, and history says “they happen when you least expect it” we could see such a sharp correction, that could trigger margin selling, which would lead to more selling pressure etc., we have all seen this movie before. I am not saying that this will take place, but if it does, and we if don’t have healthy corrections along the way, which we haven’t, this could magnify matters and we would be having a much different discussion.

With all that said, I will continue to monitor the economic numbers this month as well as the technical make-up of the aforementioned indices. Technically speaking, we are now approaching overbought territory according to the relative strength index (RSI). Paula and I wish everyone a very safe and Happy Labor Day 🙂

~George