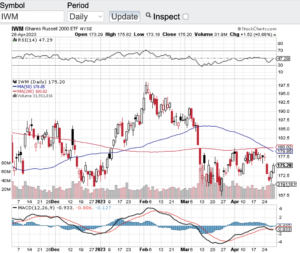
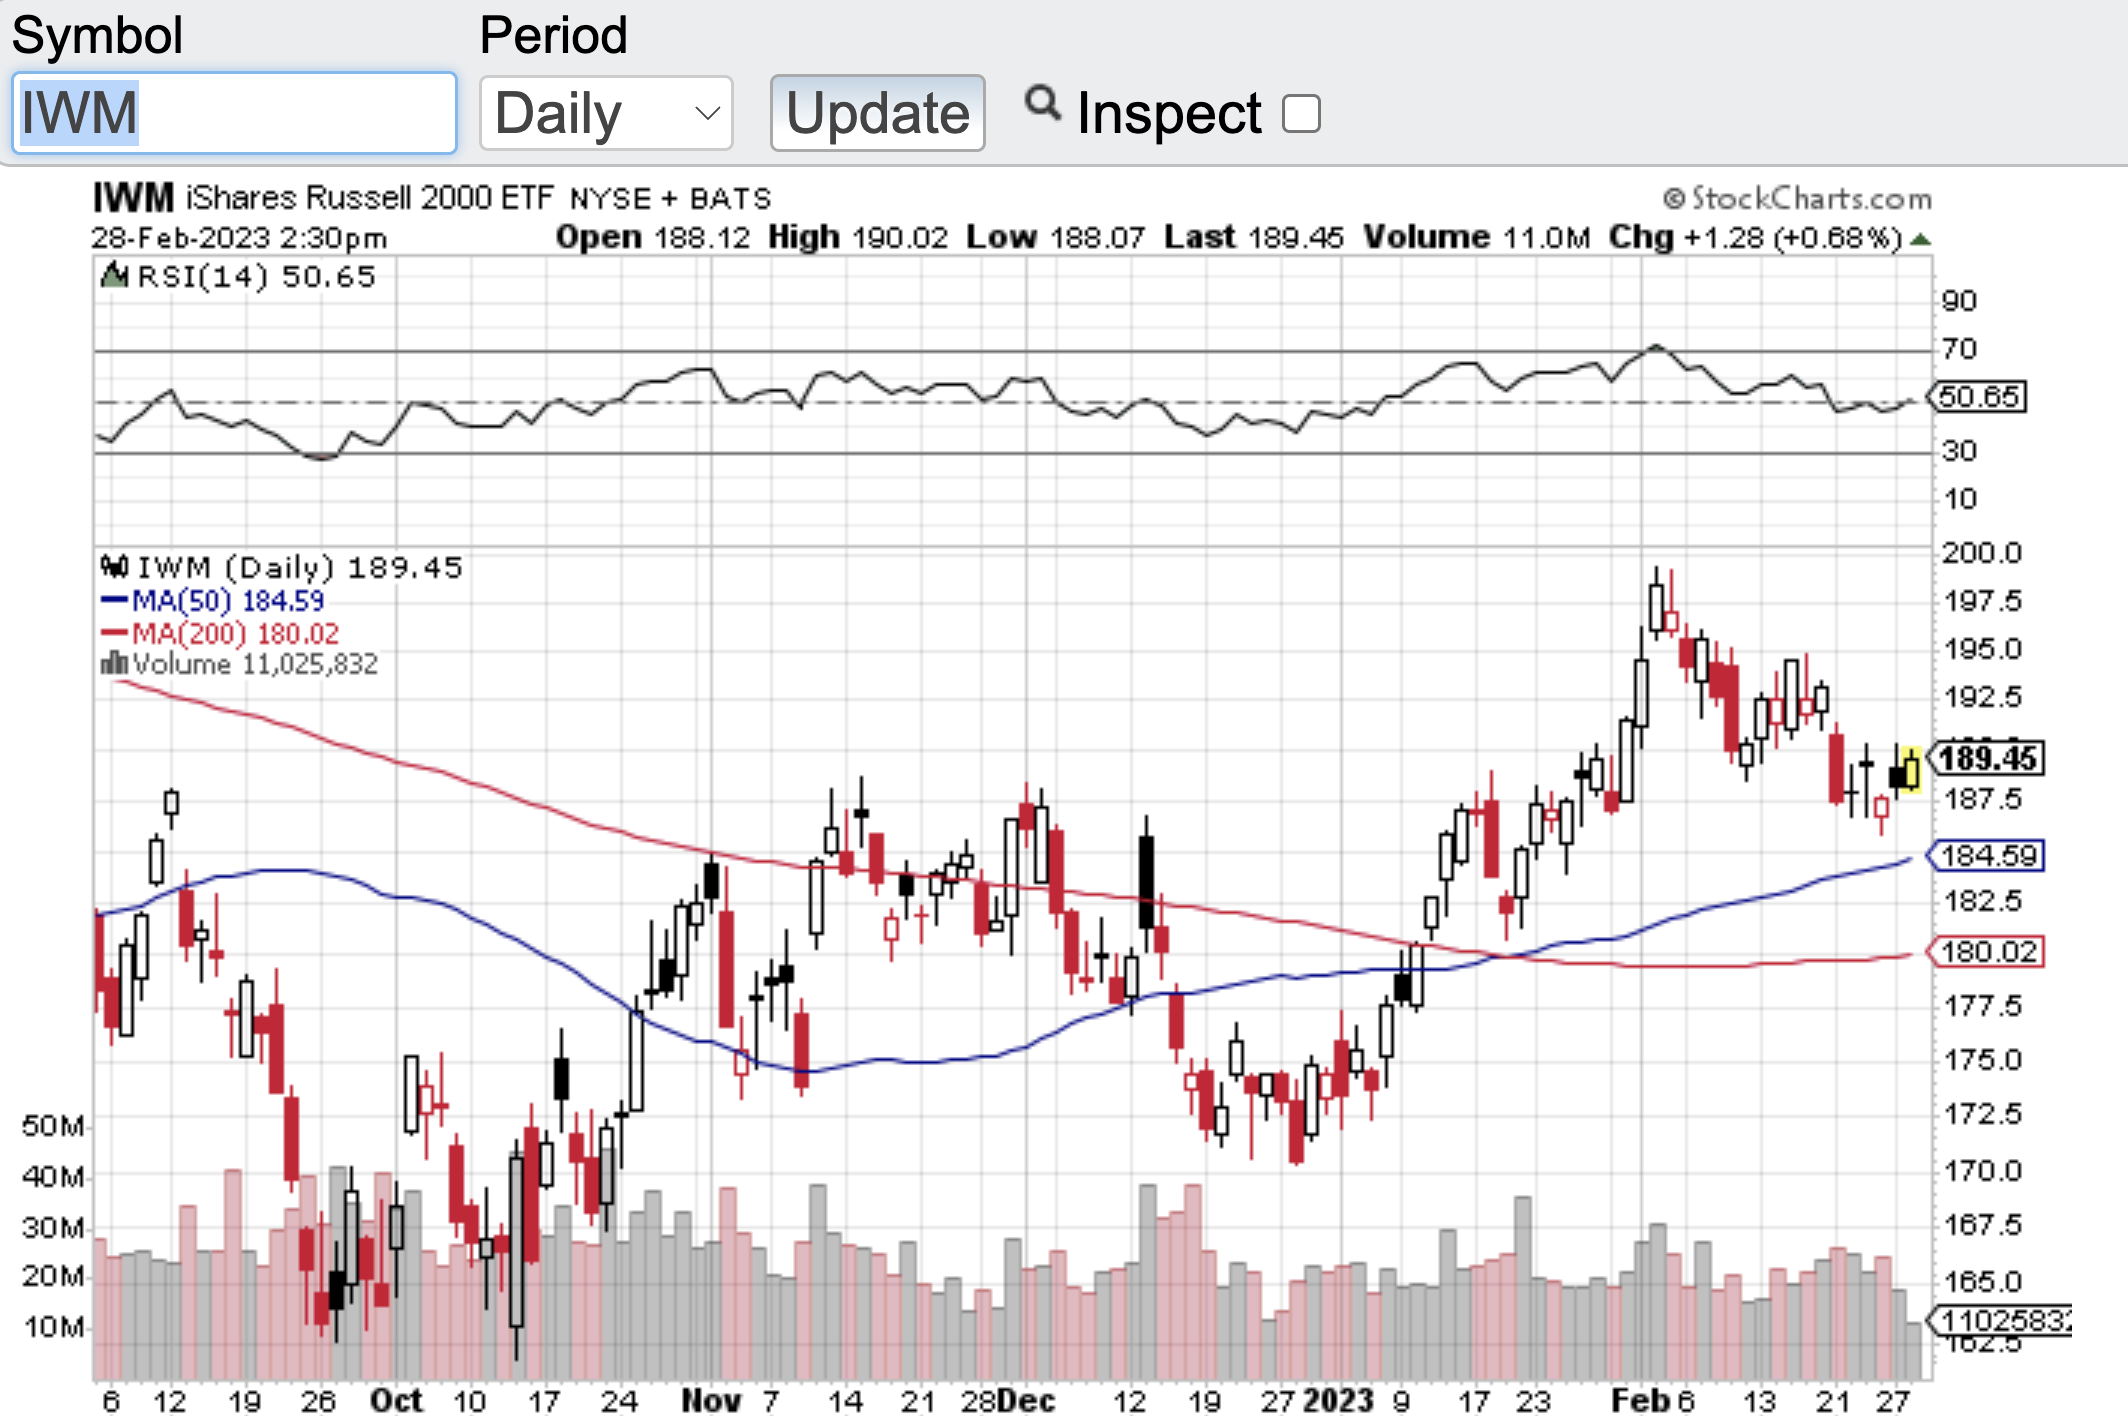
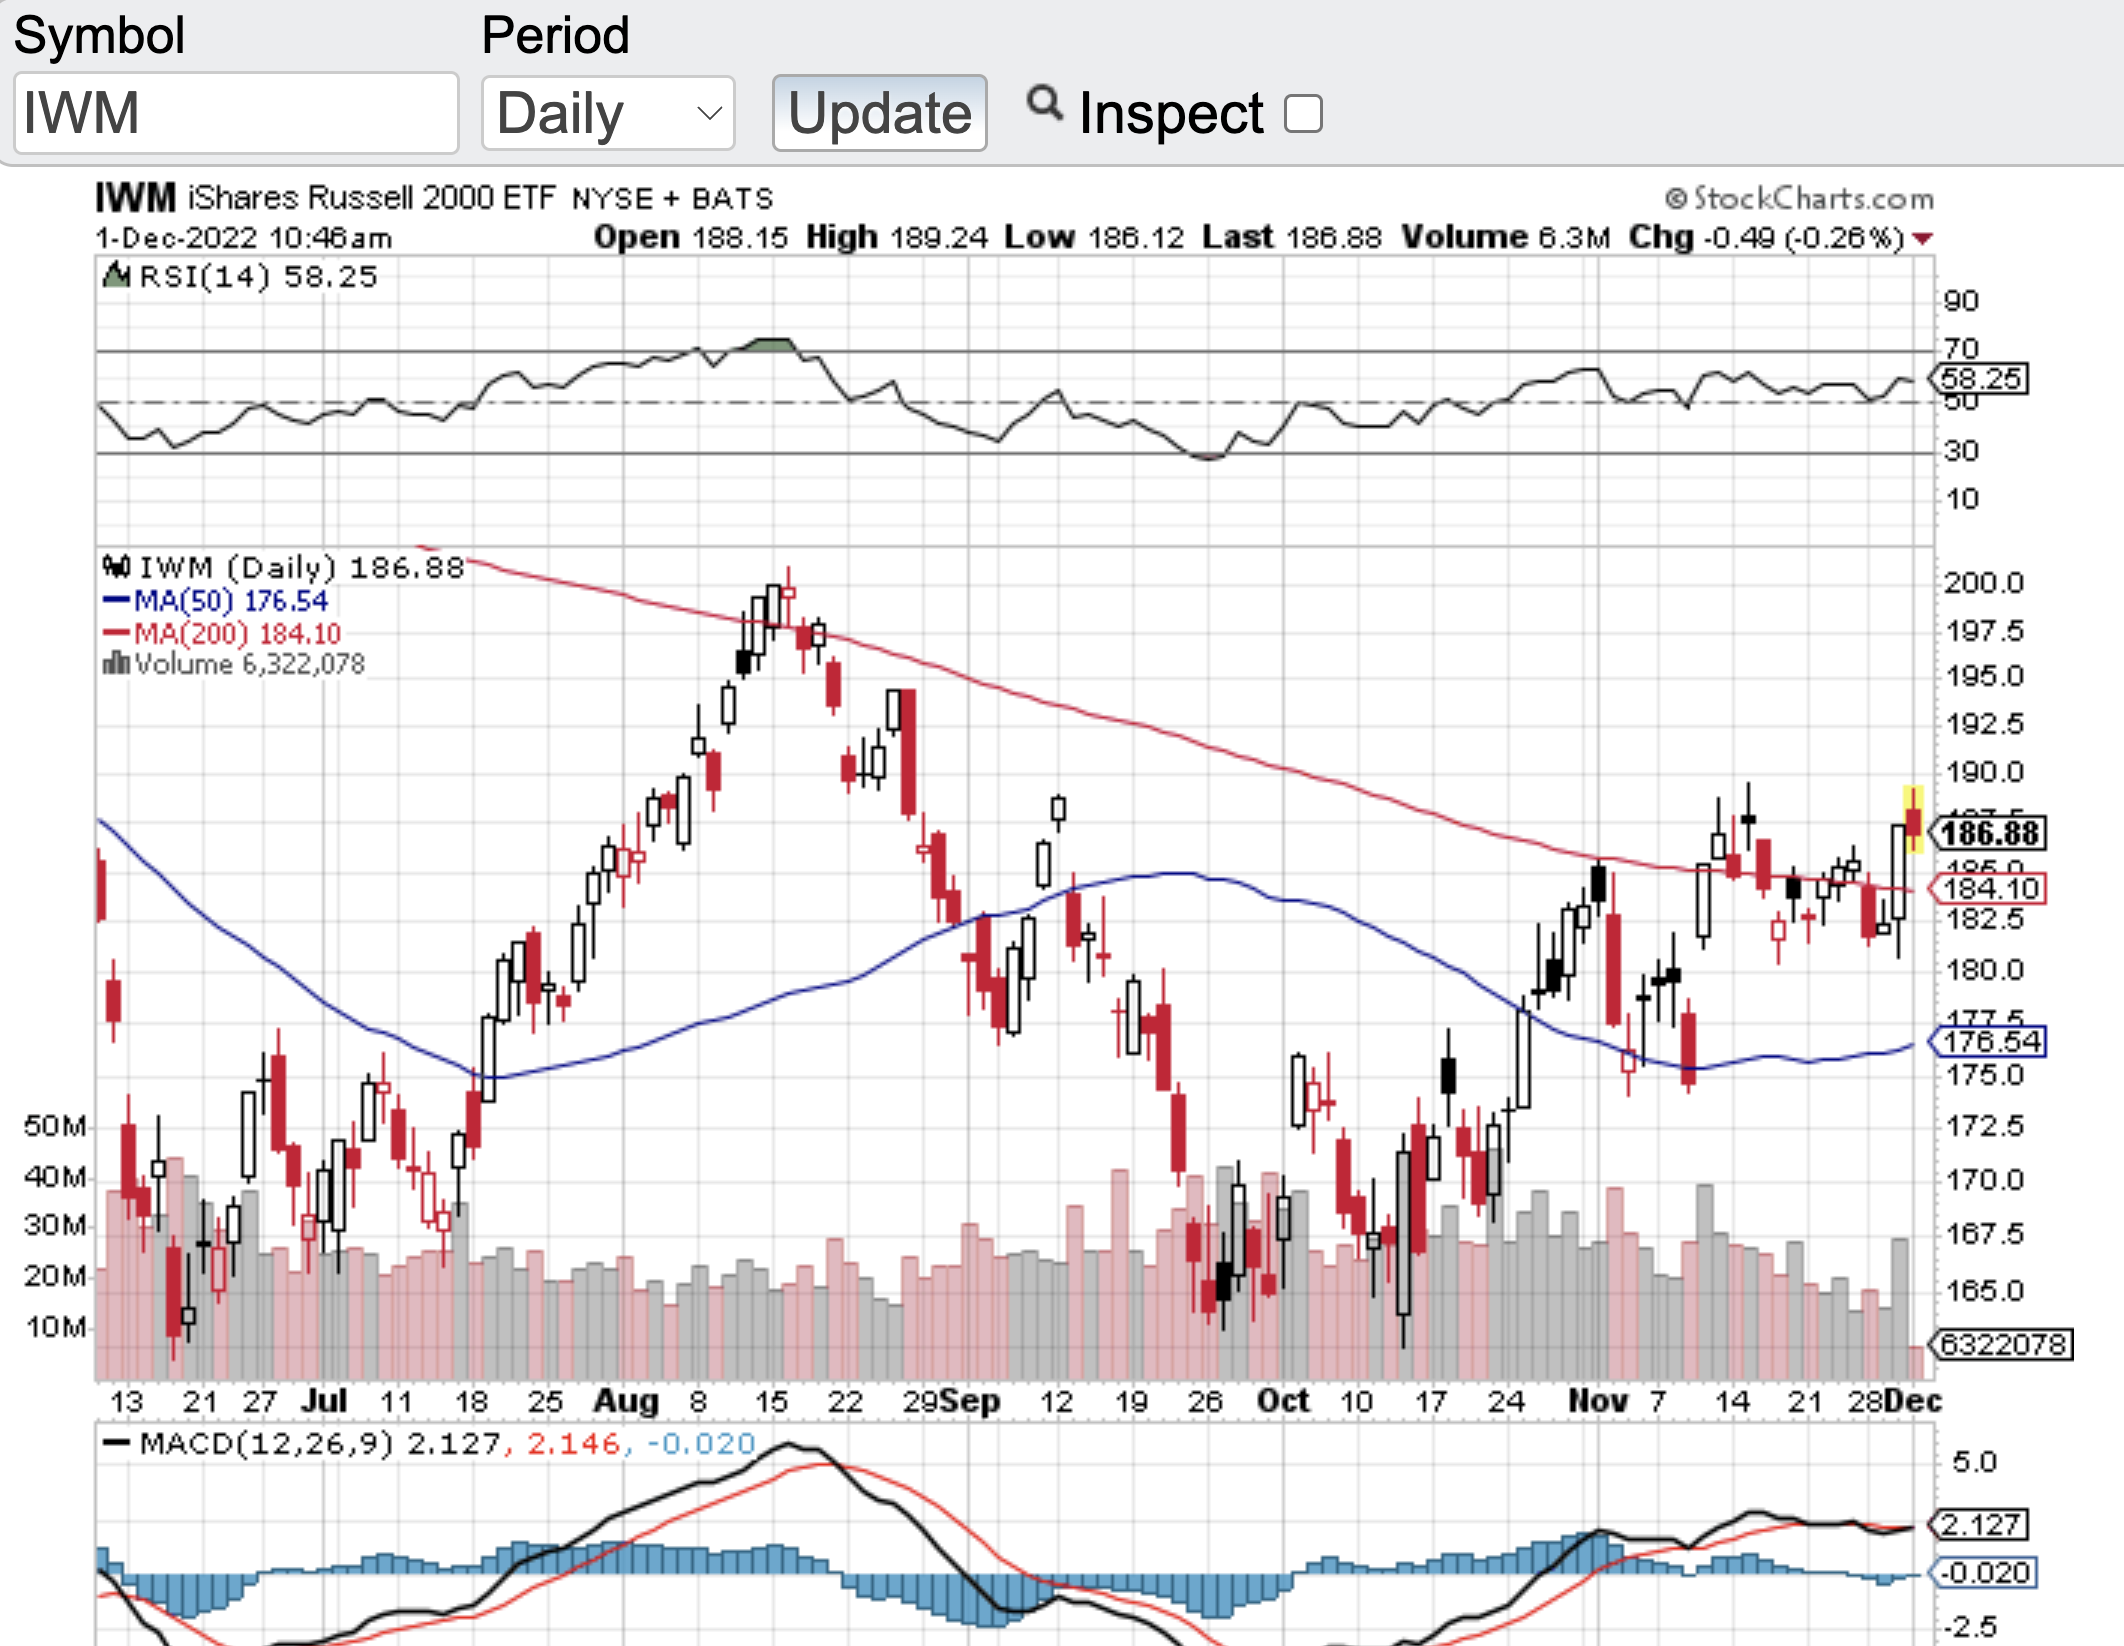
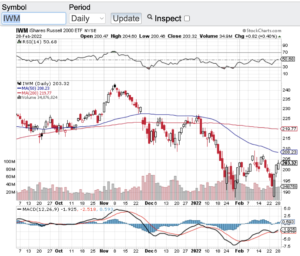
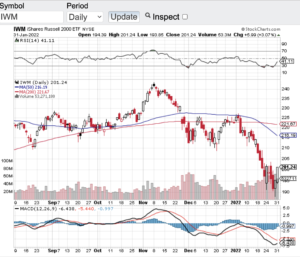
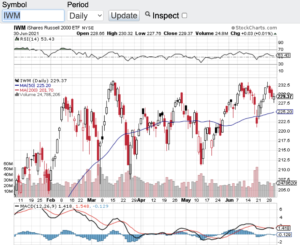
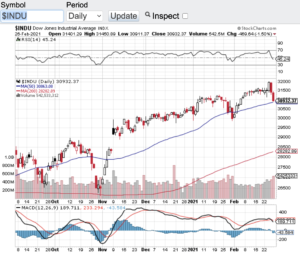
No June Swoon This Year…

No June swoon this year, these markets are simply not having it. June historically can be either a slow month or a month of selling pressure. Neither really happened this year. Despite a brief dip in the major averages a couple of weeks back due to inflation concerns, stocks and indexes held their own last month. The Dow Jones Industrial Average (see chart here) closed out the month at 34502, the S&P 500 (see chart here) finished the month just shy of 4400, the Nasdaq Composite (see chart here) closed out the month in record territory at 14503 and the small-cap Russell 2000 (see chart below) finished the month and first half of the year at 2310.

I remain in awe of the resiliency of stocks and most every other asset class out there. I read the other day that Facebook (NasdaqGS: FB) has become the fifth company in the United States to surpass the $1 trillion value mark. We now have in our country five companies that are valued at over $1 trillion dollars. Apple (NasdaqGS: AAPL), Amazon (NasdaqGS: AMZN), Microsoft (NasdaqGS: MSFT) and Alphabet aka Google (NasdaqGS: GOOGL) round out the top five trillion-dollar companies. When I see this type of action it makes me wonder how much earnings power do these companies need to continue to exhibit in order to keep their eye-popping valuations going? One other obvious similarity is the companies are all tech stocks and that is where the real growth has been. If you go back 20 years, I don’t think anyone would of expected five companies in our markets all reaching and boasting trillion dollar plus valuations. Heck, Microsoft’s market cap just surpassed $2 trillion dollars to join Apple as the only companies with more than a $2 trillion dollar valuation. Folks I am not a forensic analyst, but my goodness how is the law of large numbers playing a role here?

As I look at the technical shape of the major averages nothing really stands out to me with the exception of the Nasdaq Composite (see chart here). The Nasdaq has just entered overbought territory according to the relative strength index aka the RSI. The Nasdaq also just hit an all-time high so I think some sort of pullback could potentially be in the offing.

Have a safe and happy 4th of July weekend πŸ™‚

~George

No June Swoon This Year - Paula Mahfouz


Does It Feel A Bit Bubbly?

Do the markets feel a bit bubbly to you? This question is beginning to surface more frequently lately and I think it’s a great question to be asking. The majority of asset classes seemingly have gone straight up without pause over the past several months. Whether it’s the stock market as a whole, the crypto space or one of the hottest trends lately are SPAC’s. What is a SPAC? A SPAC is a special purpose acquisition vehicle that is publicly traded but has no assets other than cash. These vehicles are specifically designed to form as a public company, raise capital and then seek out companies to acquire. For example the electric vehicle space has been one of the favorite sectors for SPAC’s to target over the past year. This is a much easier pathway for private companies to go public without having to go through the time and expense of a traditional IPO.

One of the problems that is happening with the SPAC trade is once they identify a target and move to acquire it, the valuations of these SPAC’s begin to rise steadily into the nosebleed section of the markets. So much speculation is occurring with these SPAC’s institutional and retail investors are willing to pay essentially any price to get on board. Let’s not forget about the day traders that add fuel to the rise in these SPAC’s. So between all of the above and now with interest rates starting to tick up, it’s now wonder we have witnessed over a 1000 point drop in the Dow Jones Industrial Average (see chart here) to close out last week. Now let’s look at the technical shape of the major averages.

The Dow Jones Industrial Average (see chart below), the S&P 500 (see chart here), the Nasdaq Composite (see chart here) and the small-cap Russell 2000 (see chart here) over the past few trading sessions have all dropped below their respective 20-day moving averages and are finding support at their 50-day. Let’s see if these key indices can hold their 50-day moving average support zone this week. If they can the uptrend could very well remain intact, if not, we could see late last weeks selling pressure continue.

Good luck to all πŸ™‚

~George

Does It Feel Bubbly? - Paula Mahfouz

Two Days To Go…

It’s two days to go before our country’s Presidential election takes place. I think most everyone now is exhausted by the process. How many more commercials can be displayed? How many more rallies can we take? What’s more is I think we have all had enough of the bashing and trashing that is going on and quite honestly this type of behavior is unbecoming of our great nation. Thank goodness this is almost over.

What has impressed me the most is how the markets have held up especially with all that is going on in our country. Yes, over the past couple of weeks the major averages have had a noticeable pullback. However, with the election at the forefront of everyone’s minds and the pandemic reaching all time highs, I have to ask myself why haven’t we seen a 20% or more correction? Instead we find ourselves in the midst of a 7-8% pullback. One of the answers very well may be how the averages are responding to their key technical support levels. Let’s first look at the Dow Jones Industrial Average (see chart here). On Friday, the Dow Jones on a intraday basis temporarily breached its 200-day moving average which is at the 26263 level. Then this bellwether average bounced sharply off of its support to close at 26501. Time and time again we have seen how important key support levels are to the markets and this was text book action pertaining to support levels at work. Friday was the perfect intraday response in how the Dow Jones Industrial Average responded to its 200-day moving average.

Now let’s take a look at the Nasdaq Composite (see chart below). On Friday, the Nasdaq essentially closed right at its 100-day moving average. So we will see this week whether or not this particular support line holds true to form. There are instances to where I have seen support levels breached for a few days or so and then respond. Whatever the case is, I am impressed with how the overall markets have weathered the backdrop of the current environment we find ourselves in.

Good luck to all πŸ™‚

~George

Two Days To Go - Paula Mahfouz


Stimulus Package Chatter Buoys Markets…

Yesterday, the lastest round of stimulus package chatter came out of Washington which helped buoy our markets. The Dow Jones Industrial Average (see chart here) closed the month of September out at 27781, the S&P 500 (see chart here) finished the month at 3363, the Nasdaq Composite (see chart below) closed at 11167 and the small-cap Russell 2000 (see chart here) finished at 1507. Although stocks had a strong close to end September, the month of September was a net negative for the markets. No question the uptick in COVID both here and abroad has put some pause to this bull market rally. Quite honestly, I think stocks have held up pretty well despite the ongoing pandemic and the constant tape bombs coming out of Washington.

Fast forward to today and we are now a month away from our Presidential election. I have got to believe that we are heading into more volatility than what we experienced in September. I think whoever watched the first Presidential debate would agree. In addition to the upcoming election, we are also heading right into Q3 earnings reporting season. Corporate America will be releasing their third quarter financial results over the next 45 days or so and that alone can create higher volatility. I am not sure what to expect when companies report their numbers and even more so how companies provide their forward looking guidance on their conference calls. Whatever the case is, I think it’s fair to say we will not be trading sideways here in the month of October.

Let’s take a gander at the technical shape of the aforementioned indexes. What has impressed me lately is how the Dow Jones Industrial Average (see chart here) found support near its 200-day moving average and more recently its 50-day moving average. The same can be said for the other major averages in how they too have found support at their respective moving averages. What’s more is these key indices are no where near overbought territory according to the relative strength index aka the RSI. So from a technical analysis standpoint, the markets look to be on solid footing.

Good luck to all πŸ™‚

~George

Stimulus Package Chatter Buoy Markets - Paula Mahfouz

A Breakout Or A Fake-out?

The major averages seemingly are on the verge of a breakout, or could it be a fake-out? The Dow Jones Industrial Average (see chart here) has recaptured the 25000 level. The S&P 500 (see chart here) has recaptured the 3000 level. The Nasdaq Composite (see chart here) believe it or not is in striking distance of its all-time high and the small-cap Russell 2000 (see chart below) is also setting up for a breakout on its own. It is beyond impressive how the markets have come roaring back since late February. There are certain pundits out there that believe that this is a classic bear market rally however to me it feels like more than that. I have to believe that one of the main reasons why stocks have come roaring back in such a short period of time is the $ trillions of dollars in liquidity that the Federal Reserve and our government has injected into the markets and the economy. In fact, the Federal Reserve has quietly indicated that it is possible that they themselves would buy stocks if needed. Talk about establishing a floor in the stock market!

Another key development in the markets is how strong the technicals look right now. Without a doubt the leadership group of this recent rally is the Nasdaq Composite (see chart here). Tech stocks have benefited the most due to the lockdown. There are more people online than ever before, hence more sales accordingly. Since mid-April, not only has the Nasdaq cleared its 200-day moving average, it also has cleared its 50, 100 and 20-day moving averages. So now the Nasdaq is trading above all of its key moving averages which is bullish. Furthermore, the Dow Jones Industrial Average (see chart here) the S&P 500 (see chart here) and the small-cap Russell 2000 have also broken above some key technical resistance levels. Another technical indicator I look at the relative strength index also known as the RSI. At this point in time the aforementioned indexes are not in overbought territory. The RSI is a momentum indicator and when the value level of the RSI goes above 70 stocks or indexes begin to become overbought. This is currently not the case.

Good luck to all πŸ™‚

~George

A Breakout Or A Fake-out - Paula Mahfouz


$7.4 Billion In One Day!

The consumer is alive and well which is evidenced by a record $7.4 billion in online sales in one day. Black Friday set a United States record for online sales and between Thanksgiving Day and Black Friday over $11 billion in online sales rang the register. Well it’s not that hard to believe when all that the stock market has done this year is set record after record. As we enter the last month of the year, the Dow Jones Industrial Average (see chart here) is trading above 28000, the S&P 500 (see chart here) starts December near an all-time high, the Nasdaq Composite (see chart below) is also near an all-time high and the small-cap Russell 2000 (see chart here) also has hit its stride breaking out above a triple top that has formed over the past few months.

I have been writing my blog for almost 10 years and I thought years one through five of the recovery from the depths of the 2008 financial crises was impressive. What’s even more impressive to me is that over the past year or so we keep setting record after record despite having one of the most unstable governments in our history. Who would have thought that with a pending impeachment, a trade war with China and tape bomb after tape bomb hitting the tape we would still be at or near record highs? Simply incredible! With that said, the Federal Reserve has done its part this year by reducing interest rates which is probably one of the main reasons the markets still remain at or near record highs.

The technical shape of the stock market appears to still be intact. Despite reaching overbought conditions last week, Friday’s pullback brought the RSI level of the aforementioned indexes back below the 70-value level. The relative strength index is a technical indicator that expresses overbought and/or oversold conditions. The 70-value level of the RSI is considered overbought while the 30-value level is considered oversold. The major indexes all traded above the 70-value level until the most recent pullback. Even if we see a meaningful pullback here in December, there are plenty of support levels that will come into play with the 20-day, 50-day, 100 and 200 day moving averages which are all below where we are trading at today and historically acts as support in sell-offs.

Good luck to all πŸ™‚

~George

$7.4 Billion In One Day! - Paula Mahfouz

An Absolutely Incredible Stock Market!

It is absolutely incredible that this stock market is weathering the threat of impeachment! We have witnessed the strongest bull market in history! Not even the threat of impeachment can rattle this market. I do not want to get too political here but if half of this is true the markets just don’t care. Then throw into the mix the constant flip flopping that is going on with the China trade war and we are still near all-time highs? This makes me believe more now than ever that passive investing has almost got a total grip on stocks. Seemingly NOTHING can shake these markets. It’s almost like close your eyes and hang on for the ride. This worries me a bit. Why? Well for starters stocks used to be valued by their proprietary nature, growth potential, earnings power and ultimate dividend yields. We have witnessed a melt up in the stock market for more than a decade despite the shocks that have come and gone. What’s more is the geopolitical risks that are here and present and now our own President is going through an impeachment process and we still are near all time highs? Simply an absolutely incredible stock market we find ourselves in!

Well there is an old saying on Wall Street and that is the “trend is your friend!” My friends there is no denying this over the past decade. Let’s also keep in mind that the market is a lot smarter than we think. Meaning, there is no panic with this latest tape bomb of impeachment. Well one can say there is no way this President will get impeached because the Senate will not roll over. This very well may be the case. One thing we can do is pay attention to how corporate America continues to perform or not perform. At some point in time one would think that valuations will matter and that the markets will begin to pay attention to the normal risks that are inherent with any market.

Good luck to all πŸ™‚

~George


Is More Volatility Ahead?

The month of August proved to be one of the more volatile months so far this year. The question now is will this volatility continue here in September? As long as the turbulent tweets continue out of Washington, I bet the vol we witnessed in August will indeed continue this month. Markets hate uncertainty and as long as our President continues to flip flop seemingly daily and then tweet about it, we could very well be in for more vol. It’s not rocket science, when the tweets are positive and have consistency, stocks go green. Then when the flip flopping occurs they go red. It is amazing to me how stocks react to every single tweet or flip out of Washington. Sure there are algorithms that are programmed to react to headlines, but because of the constant noise out of Washington it’s no wonder we have been whipsawing around.

I always try to tune out the noise and focus on the fundamentals and technical shape of the markets. Let’s take a look at the current price to earnings ratio (click here) of the S&P 500. The S&P 500 (see chart here) price to earnings ratio continues to trade above historic norms. Despite all of the current uncertainties especially with the trade war, stocks on average are still trading above the 20 PE ratio level. The historic price to earnings average for the S&P 500 is somewhere in the mid-teens. So from a fundamental valuation standpoint the markets remain at the upper end of the channel. There are many other valuation metrics and government policies that play into the valuation analysis mix, but purely from a price to earnings ratio, one can ascertain that we remain a bit overpriced.

That said, companies can certainly grow into their current valuations but we definitely need to get the trade war with China resolved so that companies know where they stand. Both Paula and I wish everyone a very happy and safe Labor Day weekend πŸ™‚

~George


Fed Rate Cuts Back In Play?

The question over the past week or so is whether or not Fed rate cuts are back in play? The May jobs numbers were way below expectations with the economy only adding 75,000 jobs. This is a far cry from the 180,000 that economists were expecting in the month of May. As intuitive as it seems a weak jobs report should equal a continuing sell-off in the markets. Not the case in the first half of the month for stocks. In fact the Dow Jones Industrial Average (see chart here), the S&P 500 (see chart here), the Nasdaq Composite (see chart here) and the small cap Russell 2000 (see chart below) all have rallied sharply so far this month. So how is it that stocks are rallying with a slowing job market? Two out of the past four months the jobs number has come in below 100,000. This is giving hope to the markets that the Federal Reserve may actually start cutting interest rates as opposed to raising them and this is why the markets are rallying. Lower interest rates has been a boon for stocks for the past decade and if the Fed starts lowering rates again, we could see all-time highs again.

What’s more is the technical shape of the aforementioned key indexes. As stocks have rallied this month, 3 out of the 4 major averages have blown through their moving averages which can provide resistance point if a stock or index is trading below their respective averages. Since the June rally began, the Dow Jones Industrial Average (click here for chart) recaptured it’s 200-day, 100-day and 20-day moving averages as did the S&P 500 ( click here for chart) and the Nasdaq Composite (click here for chart). However the small-cap Russell 2000 (click here for chart) has run into its 100 and 200 day moving averages and has found resistance at these key pivot points.

Let’s see how the rest of June goes and see if this past weeks consolidation will offer yet another leg up in the markets. Good luck to all πŸ™‚

~George

Russell 2000 - George Mahfouz Jr

Will Earnings Take The S&P To All Time Highs?

Now that earnings reporting season is upon us, will Q1 corporate earnings take the S&P 500 (see chart here) to all time highs? We are about to find out. For the first time in months the S&P 500 (see chart here) closed above the 2900 mark and is now within striking distance of its record close of 2940 set back in September. Once again the markets feel like they are in melt up mode. The Dow Jones Industrial Average (see chart below) closed on Friday at 26412 just 500 points away from its record high, the Nasdaq Composite (see chart here) is approaching the 8000 level a level it hasn’t seen in months, and last but not least the small-cap Russell 2000 (see chart here) is approaching the 1600 level and trading above its 200-day moving average.

The technical shape of the markets also appear to be healthy heading into Q1 earnings reporting season. All of the aforementioned indexes are trading above their 20-day, 100-day and 200-day moving averages. A good sign. Furthermore, none of these averages are in overbought territory this according the the relative strength index. Yet, another good sign.

Back to Q1 earnings reporting season. Although analysts and market pundits expect corporate earnings to have declined this quarter, I will be paying attention to the guidance that companies give. It’s no secret there has bee a global slowdown lately due to a variety of factors. However, if companies give better than expected guidance, then most likely we should indeed see new record highs.

Companies to look out for this week that are reporting are, Citigroup (NYSE: C), Goldman Sachs (NYSE: GS), Bank of America (NYSE: BAC), Johnson & Johnson (NYSE: JNJ), Netflix (NasdaqGS: NFLX), United Continental Holdings (NasdaqGS: UAL), Abbott Labs (NYSE: ABT), Alcoa (NYSE:AA), Las Vegas Sands, Corp. (NYSE: LVS), PepsiCo, Inc. (NasdaqGS: PEP), American Express (NYSE: AXP) and Honeywell International (NYSE: HON) just to name a few. Let’s see if Q1 earnings reporting season becomes the catalyst for new record highs. Good luck to all πŸ™‚

~George

Dow Jones Industrial Average - Paula Mahfouz