The 200-Day Is In Play…

The 200-day moving average is in play! Last week, the Dow Jones Industrial Average (see chart here) breached its 200-day moving average. What does this mean? Well from a technical standpoint the 200-day moving average is one of the more respected support lines when it comes to indexes or stocks. A breach of the 200-day is not what the bulls want to see. The same rings true when stocks or indexes breakthroughs and breaks out above this key technical indicator. When this occurs, it is typically viewed as bullish. Unfortunately, this is not the case today. As mentioned above, the Dow Jones Industrial Average breached its 200-day and closed the week below this support line.

Now before this draws too much attention or significance, these types of technical breaches can be short lived to only recapture this key technical support line and resume its upward trend. We will have to see if this is the case here. Why this technical breach isn’t too alarming yet, is because when I look at the broader markets such as the S&P 500 (see chart here) and the Nasdaq Composite (see chart here) both remain above their respective 200-day moving averages. The same cannot be said for the small-cap Russell 2000 (see chart here). Like the Dow Jones Industrials, the small-cap Russell 2000 also is trading below its 200-day.

So now what? As we head into the month of October, I can say with confidence that the markets will not hang around wondering which direction to take. A breach is a breach, either it follows through and continues its downward trend, or the breach is short lived only to resume its upward trend. One of the upcoming catalysts that will impact the markets is the 3rd quarter earnings reporting season and this my friends will be a determining factor as we head into year-end.

Good luck to all 🙂

~George
The 200-Day Breached…

In my March blog I highlighted the 200-day moving average and questioned whether or not this key support zone would hold on the major averages. Low and behold the 200-day moving averages were breached for the better part of the month only to come roaring last week. The Dow Jones Industrial Average (see chart here) closed the month up slightly at 33274, the S&P 500 (see chart here) also closed in the green at 4109, the Nasdaq Composite (see chart here) closed the month up at 12221 points, however the small-cap Russell 2000 (see chart here) did not recapture its 200-day and closed the month of March lower at 1802.

As mentioned above, although the markets experienced heavy selling pressure last month which was fueled by the collapse of Silicon Valley Bank, in the final the week of March the markets experienced a meaningful rally which propelled most of the major averages right back through their respective 200-day. The response to this 200-day breach and how the major averages blew right past this technical line is seemingly bullish.

With the first quarter in the books market participants will now begin to focus on Q1 earnings reporting season to see how well corporate America is doing. Last month there was the shock of Silicon Valley Bank failing and that certainly drew the attention of the Federal Reserve. This event may guide the Fed going forward to change their current interest hike program. If the Fed starts easing interest rate hikes this could help the overall selling pressure that the markets have experienced so far this year. Furthermore, if Q1’s earning reporting season goes better than expected or at least if companies guide up a bit, this may be enough to quell the selling.

Let’s see what is in store for April and hopefully we continue to see the selling pressure ease up. Good luck to all 🙂

~George

Trade War Back On!

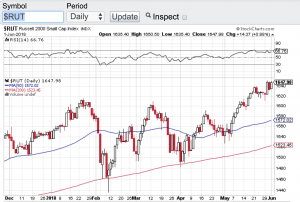
Here we go again, the trade war is back on! Donald Trump yesterday once again fired up the trade war this time including the EU, Mexico and Canada. How is an investor supposed to confidently invest when the message and policies of our government change almost daily. Stocks all week have been whipsawed around which is great for the trader, but no so much for the investor. Now we have countries from around the world retaliating with their own tariffs on our goods. The Dow Jones Industrial Average (chart) finished the week at 24635, the S&P 500 (chart) closed the week out at 2734, the Nasdaq Composite (chart) closed at 7554 and the small-cap Russell 2000 (see chart below) showing its incredible resilience finishing the week out near an all-time high.

The chop action that we are seeing in the markets along with the unpredictably of our government gives me more reason now to focus in on the technical trading patterns of stocks and indices. Whether it is support or resistance levels vis à vis moving averages (click here) i.e. the 20-day, 50-day, 100-day, 200-day or outright overbought or oversold conditions using the Relative Strength Index (click here) or the Bollinger Bands (click here) which can also provide a technical look into extreme conditions. With Q1 earnings reporting season essentially wrapped up, there is no real apparent catalyst to move the markets in a meaningful way. Which is why I will be paying much closer attention to the technical make up of the markets to identify opportunities.

One of my favorites are the moving averages (click here) especially the 200-day moving average. For example, just take a look at the Dow Jones Industrial Average (chart) and the S&P 500 (chart). You’ll see over the past few months each time these indexes gravitated to their respective 200-day MA, they found support and proceeded higher. There is no guarantee that moving averages will always hold and provide support, but in many instances it indeed acts as a short term floor to selling pressure. There are many resources on how technical analysis can work and I would recommend studying the dynamics of TA before including it in your investment or trading strategies. Good luck to all 🙂

~George

Russell 2000 - Paula Mahfouz