$7.4 Billion In One Day!

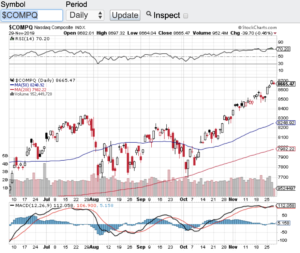
The consumer is alive and well which is evidenced by a record $7.4 billion in online sales in one day. Black Friday set a United States record for online sales and between Thanksgiving Day and Black Friday over $11 billion in online sales rang the register. Well it’s not that hard to believe when all that the stock market has done this year is set record after record. As we enter the last month of the year, the Dow Jones Industrial Average (see chart here) is trading above 28000, the S&P 500 (see chart here) starts December near an all-time high, the Nasdaq Composite (see chart below) is also near an all-time high and the small-cap Russell 2000 (see chart here) also has hit its stride breaking out above a triple top that has formed over the past few months.

I have been writing my blog for almost 10 years and I thought years one through five of the recovery from the depths of the 2008 financial crises was impressive. What’s even more impressive to me is that over the past year or so we keep setting record after record despite having one of the most unstable governments in our history. Who would have thought that with a pending impeachment, a trade war with China and tape bomb after tape bomb hitting the tape we would still be at or near record highs? Simply incredible! With that said, the Federal Reserve has done its part this year by reducing interest rates which is probably one of the main reasons the markets still remain at or near record highs.

The technical shape of the stock market appears to still be intact. Despite reaching overbought conditions last week, Friday’s pullback brought the RSI level of the aforementioned indexes back below the 70-value level. The relative strength index is a technical indicator that expresses overbought and/or oversold conditions. The 70-value level of the RSI is considered overbought while the 30-value level is considered oversold. The major indexes all traded above the 70-value level until the most recent pullback. Even if we see a meaningful pullback here in December, there are plenty of support levels that will come into play with the 20-day, 50-day, 100 and 200 day moving averages which are all below where we are trading at today and historically acts as support in sell-offs.

Good luck to all 🙂

~George
$7.4 Billion In One Day! - Paula Mahfouz

Is More Volatility Ahead?

The month of August proved to be one of the more volatile months so far this year. The question now is will this volatility continue here in September? As long as the turbulent tweets continue out of Washington, I bet the vol we witnessed in August will indeed continue this month. Markets hate uncertainty and as long as our President continues to flip flop seemingly daily and then tweet about it, we could very well be in for more vol. It’s not rocket science, when the tweets are positive and have consistency, stocks go green. Then when the flip flopping occurs they go red. It is amazing to me how stocks react to every single tweet or flip out of Washington. Sure there are algorithms that are programmed to react to headlines, but because of the constant noise out of Washington it’s no wonder we have been whipsawing around.

I always try to tune out the noise and focus on the fundamentals and technical shape of the markets. Let’s take a look at the current price to earnings ratio (click here) of the S&P 500. The S&P 500 (see chart here) price to earnings ratio continues to trade above historic norms. Despite all of the current uncertainties especially with the trade war, stocks on average are still trading above the 20 PE ratio level. The historic price to earnings average for the S&P 500 is somewhere in the mid-teens. So from a fundamental valuation standpoint the markets remain at the upper end of the channel. There are many other valuation metrics and government policies that play into the valuation analysis mix, but purely from a price to earnings ratio, one can ascertain that we remain a bit overpriced.

That said, companies can certainly grow into their current valuations but we definitely need to get the trade war with China resolved so that companies know where they stand. Both Paula and I wish everyone a very happy and safe Labor Day weekend 🙂

~George


The T-Word Has Done It Again!

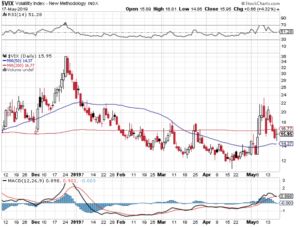
No question the T-word has done it again aka tariffs. The week started off with China’s retaliation to the Trump tariffs with a market sell-off on Monday sending the Dow Jones Industrial Average (see chart here) down 600 points. The trade war also sent volatility soaring earlier in the week as well $VIX (see chart below). This after the market set all-time highs. No matter what the case is, stocks will continue to sell-off on any negative tariff news. Why not? Tariffs can essentially act as a tax on American businesses and the consumer at least in the short term.  Without question the tariff tape bombs have hit the market and had nearly doubled the price of vol over the past week or so. (see chart here) 

Now that the wild market swings are back, what’s next? Whenever I see a pick up in vol I take a closer look at the technical shape of the key indexes. Let’s start with the Dow Jones Industrial Average (see chart here). Since volatility kicked back in the Dow Jones Industrial Average lost around 1000 points, but found support at its 100 and 200-day moving averages and bounced off of those key support levels. The S&P 500 (chart) also sold off sharply over the past week or so but it too bounced off of key support zones. The Nasdaq Composite (chart) sold off almost identical to the S&P and bounced back nicely.  Last but not least, the small-cap Russell 2000 (chart) actually fell through its 200-day moving average and found support at its 100-day. So technically speaking and if you are in the bull camp this is a very good sign for the continuation of the latest upward trend in the market. I am always a fan of pullbacks that meet support, holds that support and resumes its uptrend and that’s what we seemingly have now.

Let’s see if we get any positive developments on the trade war to calm the markets down a bit. Good luck to all 🙂

~George

$VIX - george mahfouz

The Economy Is Booming, But…

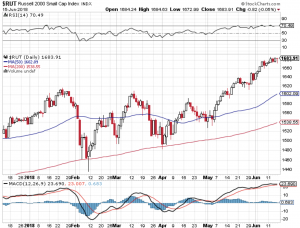
There is no question the economy is booming but what does this mean long term for stocks? When the economy is firing on all cylinders like it is now here in the United States one may think the stock market must be ready for its next leg up! Not so fast. Historically when the economy heats up and the unemployment rate becomes so low, that does not typically bode well for stocks. Why you ask? Simply put, the Federal Reserve does not want inflation to rear its head up and their main tool to avert inflationary pressures is to raise interest rates. As counterintuitive as it may seem, a strong economy and low unemployment may be the catalyst to put the brakes on this almost 10 year bull market run. That said, the major averages continue to show extraordinary resilience no matter what comes at it. The Dow Jones Industrial Average (chart) closed the week above 25,000, the S&P 500 (chart) finished the week at 2779, the Nasdaq Composite (chart), finished near its all time high and the small-cap Russell 2000 (see chart below) closed the week out a few points away from it’s all time high as well.

It is quite remarkable how the aforementioned indexes are behaving with all things considered. This past week the Federal Reserve raised interest rates again and signaled two more hikes this year and the trade war chatter and action with China and our own allies for that matter is accelerating. Just these two events alone show be putting selling pressure on stocks not setting new record highs as is the case this past week with the Nasdaq Composite (chart) and the Russell 2000 (chart). These indexes also remain well above key moving averages which at some point in time reversion to the mean should occur. I will be looking for opportunities on the short side but will continue to respect the fact that this years-long bull market remains intact at least from a technical standpoint. Good luck to all 🙂

~George

george mahfouz jr - Russell 2000


Trade War Back On!

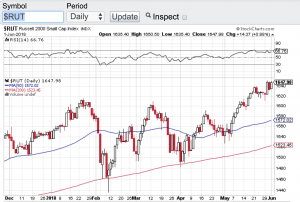
Here we go again, the trade war is back on! Donald Trump yesterday once again fired up the trade war this time including the EU, Mexico and Canada. How is an investor supposed to confidently invest when the message and policies of our government change almost daily. Stocks all week have been whipsawed around which is great for the trader, but no so much for the investor. Now we have countries from around the world retaliating with their own tariffs on our goods. The Dow Jones Industrial Average (chart) finished the week at 24635, the S&P 500 (chart) closed the week out at 2734, the Nasdaq Composite (chart) closed at 7554 and the small-cap Russell 2000 (see chart below) showing its incredible resilience finishing the week out near an all-time high.

The chop action that we are seeing in the markets along with the unpredictably of our government gives me more reason now to focus in on the technical trading patterns of stocks and indices. Whether it is support or resistance levels vis à vis moving averages (click here) i.e. the 20-day, 50-day, 100-day, 200-day or outright overbought or oversold conditions using the Relative Strength Index (click here) or the Bollinger Bands (click here) which can also provide a technical look into extreme conditions. With Q1 earnings reporting season essentially wrapped up, there is no real apparent catalyst to move the markets in a meaningful way. Which is why I will be paying much closer attention to the technical make up of the markets to identify opportunities.

One of my favorites are the moving averages (click here) especially the 200-day moving average. For example, just take a look at the Dow Jones Industrial Average (chart) and the S&P 500 (chart). You’ll see over the past few months each time these indexes gravitated to their respective 200-day MA, they found support and proceeded higher. There is no guarantee that moving averages will always hold and provide support, but in many instances it indeed acts as a short term floor to selling pressure. There are many resources on how technical analysis can work and I would recommend studying the dynamics of TA before including it in your investment or trading strategies. Good luck to all 🙂

~George

Russell 2000 - Paula Mahfouz


Risks Abound!

As we enter into Q1 earnings reporting season there are risks abound! Whether it’s the brewing trade war with China, rising interest rates here at home or geopolitical tensions in the middle east, the risk profile of this market has certainly increased in recent weeks. Money center banks such as JP Morgan Chase (NYSE: JPM), Citigroup (NYSE: C) and Wells Fargo (NYSE: WFC) kicked off earnings reporting season and all reported solid earnings numbers only to see their stocks falter on Friday. So we could be setting up for a better than expected earnings reporting season and the markets won’t care due to the aformentioned risks that are present. We will certainly find out this upcoming week as hundreds of companies are set to report their quarterly results. We kick off the week with earnings from Bank of America (NYSE: BAC), Charles Schwab Corp (NYSE: SCHW), Netflix (NasdaqGS: NFLX) followed by Goldman Sachs (NYSE: GS), Johnson & Johnson (NYSE: JNJ), Intuitive Surgical (NasdaqGS: ISRG), United Continental Holdings (NYSE: UAL), United Healthgroup (NYSE: UNH), Abbot Labs (NYSE: ABT), American Express (NYSE: AXP), Morgan Stanley (NYSE: MS), United Rentals (NYSE: URI), Etrade Financial Corp. (NasdaqGS: ETFC), General Electric (NYSE: GE) Honeywell International (NYSE: HON), Procter & Gamble (NYSE: PG), Schlumberger (NYSE: SLB) and Transunion (NYSE: TRU) just to name a few.

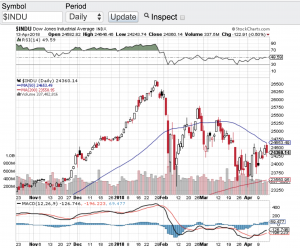
Let’s take a gander at the technical shape of the markets. The Dow Jones Industrial Average (see chart below) has bounced off of its 200-day moving average multiple times over the past couple of weeks and is now hovering at its 20-day, the same can be said for the S&P 500 (chart), the Nasdaq Composite (chart) is right on its 20-day and 100-day moving averages as is the small-cap Russell 2000 (chart). So all of the key indices are at or slightly above key support levels and just maybe between earnings reporting season and key support levels in play, stocks can withstand the risks that are currently present. Good luck to all 🙂

~George

Dow Jones - George Mahfouz Jr