New Year, New Records?

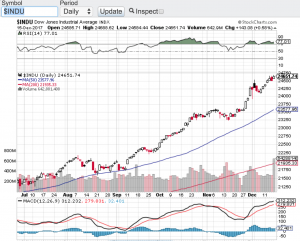
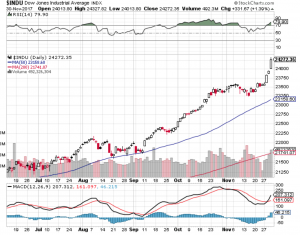
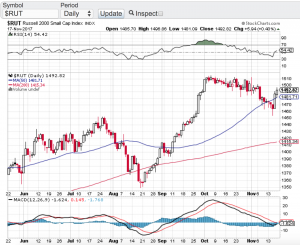
Happy New Year! Will 2018 be a new year of new records? Nothing would surprise me. Especially as the Dow Jones Industrial Average (chart), the S&P 500 (chart), the Nasdaq (chart) and the small-cap Russell 2000 (chart) shattered record after record after record in 2017. In fact the Dow Jones Industrial Average set 70 record closing highs in 2017. That’s not a typo folks, 70 record closing highs. The other aforementioned key indices also set multiple record highs throughout last year. So could we see a repeat performance in 2018? I don’t know about another 70 record highs this year but I would not be surprised to see continuing strength in the markets in 2018. Yes the Federal Reserve is now in a rate hike mode which typically does not bode well for stocks, but this Fed and central banks from around the world understand the need to go about their new rate hike policies in a gradual manner. Raising rates too aggressively could be the exact catalyst to put the brakes on this almost decade long bull market. I don’t think this will be the case at least with our own Federal Reserve. Jerome Powell will be replacing Janet Yellen in early February as our new Federal Reserve Chairman. Mr. Powell who has been a member of the Federal Reserve’s board of governors since 2012 has voted for keeping interest rates at bay while the economy continues to recover.

Speaking of the economy, expansion continues to occur and we will soon find out how our economy isΒ  trickling down into corporate America. Fourth quarter earnings reporting season will begin here in January and this could very well serve as a key catalyst for the continuation of the bull market. That said, I think most investors and traders are looking for the markets to pause and pullback from this historic run we continue to be on. It is truly breathtaking to witness the record pace that stocks have enjoyed for years now. Personally, I hope and some point in time we do get a meaningful pullback so we can have the opportunity to step in at lower prices. Good luck to all and Paula and I wish everyone the healthiest and happiest new year! πŸ™‚

~George

Within Striking Distance!

In my previous blog, I said I wouldn’t be at the very least surprised if the Dow Jones Industrial Average (see chart below) closed above 25000 by year end. Well don’t look now, we are in striking distance of that milestone. In fact, if the Dow does close above 25000 by year end, it would have taken it a month to do so. That’s right only a month! In late November the Dow closed above the 24000 mark for the very first time and now its a mere 350 points away from yet another 1000 point gain. What’s impressive about this 1000 point clip is how fast it is getting there, I mean a month? This is unprecedented for sure. Market observers are expecting this insatiable bull market to keep on truckin into the end of the year, especially if the tax bill goes live! The S&P 500 (chart) and the Nasdaq Composite (chart) also closed at records highs on Friday with the S&P 500 closing in on the 2700 mark and the Nasdaq approaching the 7000 mark. The small-cap Russell 2000 (chart) is lagging behind but on Friday the Russell did find support at its 200-day moving average to close higher on the week.

With only 2 weeks left in the trading year what can investors or traders expect? More of the same or a sell the news type event? The news being the proposed tax bill getting through and going live. I truly don’t know? However, when you add seasonality into the mix with December being one of the strongest months for stocks on the year, I would not be surprised if the Dow Jones Industrial Average does indeed eclipse the 25000 mark. We could also see the S&P 500 overtake 2700 and the Nasdaq surpass 7000. Now if there is a snag in getting the tax bill through or if it ends up being a “sell the news” type of event meaning the proposed tax bill does go through by year end, then I will have a much different take heading into the new year. Both Paula and I wish everyone the healthiest and happiest holiday season πŸ™‚

~George

Dow Jones Industrial Average - Paula Mahfouz

Dow 24,000 – Bitcoin $10,000 – Why Not?

Is this really happening? Stocks exploded to the upside on the last trading day of November. For the first time in its history, the Dow Jones Industrial Average (see chart below) traded, blew through and closed above the 24,000 mark. The Dow started the year just under 20,000 and no one and I mean no one in the who’s who of finance, analysis, technical analysis, hedge funds, institutional investors and the like, ever predicted this type of performance for stocks and the key indices on the year. I cannot even count the number of record highs that have occurred this year not only in the Dow Jones Industrials, but also the S&P 500 (chart), the Nasdaq composite (chart), and the small-cap Russell 2000 (chart). Let’s throw in Bitcoin and its year to date 10X performance and we are truly in party mode.

I am not even sure what to think? This eerily feels like the irrational exuberance environment that occurred in the mid to late 90’s and before the internet bubble imploded. However the bullish pundits are quick to point out that this time is different. Back then, whoever came out with an announcement that they just launched a website saw their stock go up. Now the pundits are pointing out that it is earnings and growth that are responsible for this torrid record setting pace we have been on all year long. This is true to some degree. But what about the euphoria in Bitcoin? What is the catalyst that has propelled this so call asset to fly up over 10 times this year? This is why the other side of the camp thinks we are approaching a bubble or at the very least nose bleed territory. Without question I feel that something is going on that makes one have to pause and take a breather here. But as we have seen all year long, don’t underestimate the power of momentum, a low interest rate environment and the Trump trade. Is it possible that the Dow Jones Industrials actually could close above 25,000 by year end? As much as I want to say and think “no way”, way! Not saying the Dow will go up another 800 points by year end, but if we do, I would not be at the very least surprised.

Good luck to all πŸ™‚

~George

Dow Jones Industrial Average - George Mahfouz Jr

Tis The Season…

As the holiday season fast approaches stocks have a lot to be jolly for. Despite the recent pop in volatility, the major averages continue to enjoy their record setting ways. The Dow Jones Industrial Average (chart) closed the week at 23,258, the S&P 500 (chart) finished the week at 2,579, the tech focused Nasdaq composite (chart) closed at 6,783 and the small-cap Russell 2000 (see chart below) ended the week at 1,493 while recapturing its 50-day moving average.

Next week is a shortened trading week due to Thanksgiving. Historically the Thanksgiving holiday week tends to be a bullish week for equities with 75 percent of the time the markets finish higher. Add the seasonality factor into the mix and things look pretty good between now and year end. This doesn’t mean that things won’t be choppy along the way especially as the yield curve has many investors paying closer attention to it. Interest rate chatter is seemingly picking up lately despite the Federal Reserve being candid about their position and intentions. This will become further apparent when Fed chair Yellen speaks next week along with the release of the minutes from the last Federal Reserve meeting. All in all it appears that the status quo should be in place between now and year and if this is the case, new market highs should be set.

Earlier I spoke to how the small-cap Russell 2000 ( see chart below) has recaptured its 50-day moving average. This is important from the standpoint that investors and traders alike look to the Russell as a key indicator to the overall health of the broader markets. Recently the Russell has been showing some cracks in its trading patterns including noticeably breaking its 50-day only to recapture it and hold above it a few days later. If you are long this market, this is a bullish sign. That said, I do expect volatility to be present between now and year with the potential of making new highs along the way.

Paula and I wish everyone a very safe and Happy Thanksgiving πŸ™‚

~George

Russell 2000 Paula Mahfouz

Russell 2000 – All Time High!

So now the small-caps join in! The Russell 2000 (chart) closed the week at an all time record high of 1490. For most of the year the widely followed small-cap Russell 2000 has lagged the other major averages. Now it has broken out, see (chart). In fact, when you look at the chart of the Russell, one can say this index has gone parabolic. The Nasdaq (chart) and the S&P 500 (chart) also closed at their all time highs on Friday, while the Dow Jones Industrial Average (chart) posted yet another positive week. What’s more is the month of September is typically one of the weakest months of the year for equities losing on average of 1.5% happening 70% of the time since the 1970’s. Not this year, in fact there have been so many record-breaking closes on all of the aforementioned indices it’s hard to keep track.

Question is, now what? With the third quarter of the year now in the books, Q3 earnings reporting season is right around the corner. I have got to believe with the Federal Reserve closing the chapter on their quantitative easing policy and now taking those assets off of their books, plus interest rates scheduled to rise, investors should pay closer attention to the health and growth of corporate earnings. Do you remember the days when earnings and earnings growth actually mattered? Well those days may be back upon us. Hence, the report cards that come in from corporate America may actually move the markets in a fundamental way. This we have not seen in almost a decade. However, if the market momentum that we have experienced since the election continues, and investors ignore the fundamentals, then why couldn’t we end the year at even higher highs?

One thing for sure is October will be filled with many catalysts that should bring in some volatility and a lot of opportunity.Β  Between now and year end may be the time to implement a hedged strategy where one can potentially profit regardless of how the indexes or individual stocks react to what’s ahead. I’ll cover this in my next blog. Good luck to all. πŸ™‚

~George

The Bears Are Baffled!

What is historically one of the weakest months of the year for stocks, the S&P 500 (chart) closed the week and halfway point of the month at an all time high of 2500. The Dow Jones Industrial Average (chart) also closed the week at a record high, along with the tech-focused Nasdaq (chart) and last but not least, the small-cap Russell 2000 (chart) appears to be closing in on a new record high as well.

The bear camp has to be completely exhausted. I mean how in the world can you have the confidence to short this market? Not even the continuation of North Korea’s missile launches can slow down one of the most significant bull markets in history. Now seemingly we need to throw out all traditional metrics, seasonalities, geo-political risks, price to earnings ratios etc. This market has been immune to any risks. I have never seen anything like this. What’s more, there are survey’s out there that indicate that professional investors are the most pessimistic about the markets since before the election. You know what that means? Stocks tend to act the opposite of street sentiment.

Over the years and as most of you know one of my favorite technical indicators and one of the preferred technical indicators of money managers and institutional trader alike is the relative strength indicator. This indicator has been a trusted source to spot overbought and for that matter oversold conditions. The problem I have encountered this year is when indexes or individual equities have reached an overbought condition according to the RSI, the pullbacks that ensue have not provided the proper risk reward to any short thesis. The retracements are so shallow and short-lived that it is not worth putting the trade on. So needless to say, this strategy is on hold for now.

I am not sure what will be the catalyst for stocks or indexes to begin trading on pure fundamentals and not on the oversupply of liquidity and low interest rates. Until then, I will be very cautious in using the traditional metrics and/or technical indicators to base my decisions off of. Good luck to all πŸ™‚

~George

Is Gold Breaking Out?

It certainly appears that way. Gold (see chart below) has caught a meaning bid as of late and it’s about time. The yellow medal has been stuck in a trading range between $1200 and $1300 per ounce for months and now has broke through the $1300 level currently trading around $1330 per ounce. What has surprised me is how long it took for gold to finally go from the left side of the chart to the right. Especially considering the geopolitical risk environment we find ourselves in. That said, stocks are saying what risk? As I write this blog, the Dow Jones Industrial Average (chart), the S&P 500 (chart), the Nasdaq (chart) and the small-cap Russell 2000 (chart) once again are all approaching all time highs. This after a very modest pullback in August. So Wall Street continues to remain in the “buy the dip” mood. All year long and every single time stocks experience any type of pullback, buyers come in and lift the markets to all time highs.

How long can this last? From a technical standpoint the key indices remain below the 70 value level of the relative strength index also referred to as the RSI. The RSI is used as a gauge by certain market technicians to see if whether or not stocks in the short term are overbought or oversold. As as these indexes approach all-time highs and should they breakthrough those highs, these markets can and should continue to go higher. However, if they do not breakout here, then one could expect yet another pullback especially as we are now in one of the more underperforming months for equites of the year. Historically September and October for that matter tends to be a difficult time for the markets. However, based on what we have witnessed all year long despite the ongoing geopolitical risks and with interest rates on the rise, the markets may not care about the seasonality trends of September and October. Good luck to all and both Paula and I wish everyone a safe and relaxing Labor Day Weekend πŸ™‚

~George

Gold chart - Paula Mahfouz

Dow 22,000 In Sight…

The Dow Jones Industrial Average (chart) closed the month of July at a record high and came within 70 points of the 22,000 mark. Just a few short months ago that the Dow surpassed the 21,000 milestone. What an incredible run in such a short period of time! Not only is the Dow Jones Industrial Average (chart) notching new record highs almost daily, the Nasdaq (chart) last Thursday posted a new record at 6460, as did the S&P 500 (chart) setting a new record of 2484. Last but not least, the small-cap Russell 2000 (chart) also set a new record last week of 1452. However, both the Nasdaq (chart) and the small-cap Russell 2000 (chart) have reversed their upward trajectory over the last few trading sessions in a noticeable manner. Let’s keep an eye on this development.

I think it is safe to say that Q2 earnings reporting season has helped fuel the Dow Jones to new record highs as well as the S&P 500. Tech stocks have been reporting a mixed bag so far this earnings reporting season which is why that index has started to abate a bit. All eyes today are on Apple (NasdaqGS: AAPL) which report their earnings results after the close. This could be the one stock that either reverses the latest mini-downward trend in the Nasdaq or for that matter, accelerate it. As I look to the technical shape of the the aforementioned indexes, only the Dow Jones Industrial Average (chart) is on overbought territory, while the S&P 500 (chart), Nasdaq (chart) and the small-cap Russell 2000 (chart) have begun their reversion to the mean and are all approaching the 50 value level of the relative strength index.

Game plan for August? Personally, I think it is time to reduce long exposure to equities due in part to this startling run stocks have had all year long. This coupled with the month of August being an historically weak month for equities could create the perfect set up for the much anticipated market correction that the bears have been waiting on. That said, I have to remind myself that there has been no such thing as typical in these markets for we have been in unchartered territory for a long period of time. One final note, it is always recommended to consult with a certified financial planner before making any adjustments to your portfolio.

Good luck to all πŸ™‚

~George


Record After Record!

Another week in the books and records continue to fall. The Dow Jones Industrial Average (chart) and the S&P 500 (chart) both closed the week at record highs, while the Nasdaq (chart) and the small-cap Russell 2000 (chart) are within a stones throw from their all-time highs. These key indices have been setting records all year long. With the exception of a few minor pullbacks throughout the year, stocks have pretty much gone up in a straight line. This despite a very tepid economic recovery here in the United States with the GDP coming in at a modest increase of 1.4%.

I think it is safe to say that this latest record setting week was due in part to Federal Reserve Chairman Janet Yellen’s dovish comments regarding interest rates and that the Fed would be very gradual in its future hikes and that such action will be determined by how well the economy fares. If the latest retail sales numbers and consumer price index number are indicative of what the Fed will do, we may not see another hike until year end or even 2018? This is just what the markets needed in order to keep a floor not only under the stocks, but the confidence to proceed as business as usual hence record setting highs.

Well the old adage of you can’t fight the tape or the Fed for that matter is certainly playing out so far in 2017. Are there any catalysts out there that could change the markets mind or its direction? Well we are about to enter the busiest week of Q2 earnings reporting season so far with over 440 companies reporting their results next week including the likes of Netflix (NasdaqGS: NFLX), Goldman Sachs (NYSE:GS), International Business Machine (NYSE: IBM), Johnson & Johnson (NYSE: JNJ), United Airlines (NYSE: UAL), American Express (NYSE: AXP), eBAY INC. (NasdaqGS: EBAY) and General Electric (NYSE: GE) just to name a few. The following week over 1400 companies will report their quarterly results. So if there is anything that could slow this bull market down right now this is it. However, if corporate America continues to report solid earnings results, new record highs could very well continue into the foreseeable future. Good luck to all πŸ™‚

~George


Where Is The Vol?

As the second quarter came to a close yesterday volatility is no where to be found. The CBOE Market Volatility Index also referred to as the VIX has been pretty much dormant this entire year (chart). Typically vol ticks up as we approach summer for a variety of reasons such as earnings reporting season, seasonality and of course the Federal Reserve policy actions. As expected the Fed did raise rates in June but the markets appear to be pricing in a higher interest rate environment. So far this year the Dow Jones Industrial Average (chart) is up 8.03%, the S&P 500 (chart) is up 8.24%, the Nasdaq Composite (chart) is up a whopping 14% and the small-cap Russell 2000 (chart) is up a modest 4.29%.

Seemingly everyday stocks are in melt-up mode. There are days where volatility tries to rear its head up, but that does not last very long. (See chart below). Even when Goldman Sachs came out with a bearish report on June 9th comparing the red-hot tech sector to the internet bubble era, the negative effect of that report lasted only a couple of days before tech found support and then proceeded to make new highs. The traders and investors that are waiting for the proverbial 10% or more correction are just not getting it. Buying the pullbacks is what has been working ever since the election but the problem is that if you are not stepping in on the 1-3% percent retracements, you are missing the next leg up. How much longer can this type of market environment last? Now that Q2 is in the books, earnings reporting season will soon begin. Let’s see if corporate earnings continue to come in stronger than analyst expectations and if so, stocks may just continue to remain bulletproof.

A quick gander at the technical shape of the aforementioned indexes and there are no signs of overbought or oversold conditions according the relative strength index. Therefore I am expecting vol to remain relatively low until at least second quarter earnings season begins. Good luck to all!

Both Paula and I wish everyone a very safe and happy Fourth of July holiday weekend πŸ™‚

~George

VIX Chart - Paula Mahfouz