Traders And Investors Are Awaiting A September Selloff…

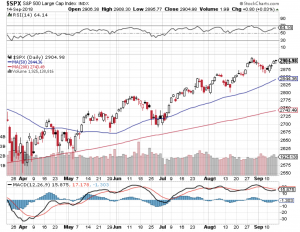
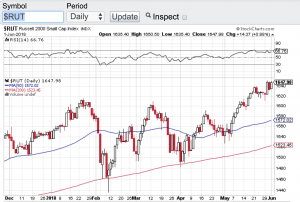
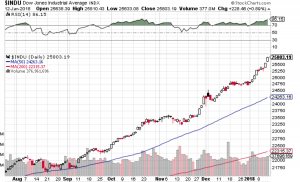
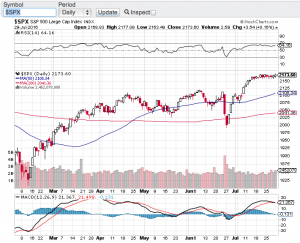
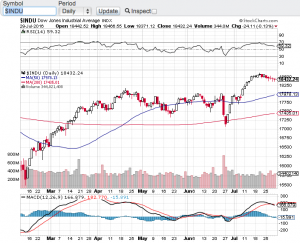
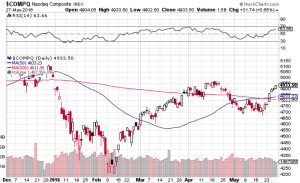
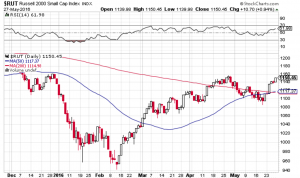
Traders and investors are awaiting a September selloff that actually may not come. Stocks continue to demonstrate strength and resiliency despite the political turmoil in Washington DC, rising interest rates and a seasonality headwind that just isn’t happening. August and September are typically weaker months for the stock market, instead the S&P 500 (see chart below), the Nasdaq Composite (chart) and the small-cap Russell 2000 (chart) hit all-time record highs and the end of August and despite a mini pullback shortly thereafter, the markets appear to have stabilized near all time highs. The Dow Jones Industrial Average (chart) did not make an all-time high in August, however, this index remains within striking distance of its all time high. The pundits are speaking to the strength of corporate America where earnings and profits are at their highest levels in decades as to the reason why the markets are not selling off. What is undeniable is that any time stocks have experienced a pull back it has been met with support from institutional investors and retail investors alike.

Speaking of support, let’s take a closer look at the technical shape of the aforementioned key indexes. Let’s start with the S&P 500 (chart). After pulling back to its 20-day moving average the S&P is right back at a breakout point. Next week we should see if the S&P can indeed breakout or fail and head back to its 20-day. The Nasdaq Composite index (chart) has similar chart pattern although it traded a bit below its 20-day support line for a few days before recapturing its 20-day and is now trading above it. A look at the Russell 2000 (chart), it too closed above its 20-day moving average and last but not least the Dow Jones Industrial Average (chart) also closed above its 20-day and this index is also right at a breakout or breakdown point. These bellwether indexes are also not in an extreme overbought condition according to the Relative Strength Index. The RSI tracks overbought or oversold conditions and is a momentum indicator that measures the degree and velocity of recent price changes to determine what is overbought and what may be oversold. We are simply not in any extreme condition according to the RSI principle.

Let’s see how the back half of September plays out and we will revisit the technical set-up of the markets in October. Good luck to all 🙂

~George

S&P 500 - George Mahfouz Jr


Trade War Back On!

Here we go again, the trade war is back on! Donald Trump yesterday once again fired up the trade war this time including the EU, Mexico and Canada. How is an investor supposed to confidently invest when the message and policies of our government change almost daily. Stocks all week have been whipsawed around which is great for the trader, but no so much for the investor. Now we have countries from around the world retaliating with their own tariffs on our goods. The Dow Jones Industrial Average (chart) finished the week at 24635, the S&P 500 (chart) closed the week out at 2734, the Nasdaq Composite (chart) closed at 7554 and the small-cap Russell 2000 (see chart below) showing its incredible resilience finishing the week out near an all-time high.

The chop action that we are seeing in the markets along with the unpredictably of our government gives me more reason now to focus in on the technical trading patterns of stocks and indices. Whether it is support or resistance levels vis Ă  vis moving averages (click here) i.e. the 20-day, 50-day, 100-day, 200-day or outright overbought or oversold conditions using the Relative Strength Index (click here) or the Bollinger Bands (click here) which can also provide a technical look into extreme conditions. With Q1 earnings reporting season essentially wrapped up, there is no real apparent catalyst to move the markets in a meaningful way. Which is why I will be paying much closer attention to the technical make up of the markets to identify opportunities.

One of my favorites are the moving averages (click here) especially the 200-day moving average. For example, just take a look at the Dow Jones Industrial Average (chart) and the S&P 500 (chart). You’ll see over the past few months each time these indexes gravitated to their respective 200-day MA, they found support and proceeded higher. There is no guarantee that moving averages will always hold and provide support, but in many instances it indeed acts as a short term floor to selling pressure. There are many resources on how technical analysis can work and I would recommend studying the dynamics of TA before including it in your investment or trading strategies. Good luck to all 🙂

~George

Russell 2000 - Paula Mahfouz


1000 Points In 7 Trading Days?

I am not even sure what to say here, almost 1000 points in 7 trading days? After closing above the 25,000 mark for the first time ever on January 4th, the Dow Jones Industrial Average (see chart below) is now closing in on the 26,000 mark in a matter of days. I simply do not understand how this bellwether index can notch 1000 point gains in such a short period of time. In fact most of the major averages are continuing to set records almost daily. How long can this go on? Without question we are on the brink of the strongest bull market in recorded history. The Dow Jones Industrial Average (chart) closed the week at a record 25,803.19, the S&P 500 (chart) closed at a record 2,786.24, the Nasdaq Composite (chart) closed at a record high of 7,261 and the small-cap Russell 2000 (chart) closed the record setting week at 1,591.90. The market was boosted on Friday in part by the strong quarterly earnings results of JP Morgan Chase.

Speaking of earnings reporting season, this week truly is the start of earnings reporting season in which most analysts expect strong top and bottom line growth from corporate America. Over the past few years the markets did witness strong bottom line growth in which a lot of that growth was due to improved efficiencies and reductions of the workforce. Now the opposite is occurring. The economy is expanding as is the job market. This should bode well for not only company earnings but for the continuation of the bull market. That said, I would think that a pullback of any kind is in the cards and I would also expect that investors and traders would be there in support of a retracement.

From a technical point of view equites are clearly overbought according to the relative strength index also referred to as the RSI. However, this favorite technical indicator has not provided the guidance and reliability as it usually does simply because these markets have remained overbought for one of the longest stretches I can remember. There will be a time where the RSI will become more reliable as it once was, but in my humble opinion you will need a “normal” market environment for this to be the case. Good luck to all 🙂

~George

dow jones - george mahfouz jr

Is Gold Breaking Out?

It certainly appears that way. Gold (see chart below) has caught a meaning bid as of late and it’s about time. The yellow medal has been stuck in a trading range between $1200 and $1300 per ounce for months and now has broke through the $1300 level currently trading around $1330 per ounce. What has surprised me is how long it took for gold to finally go from the left side of the chart to the right. Especially considering the geopolitical risk environment we find ourselves in. That said, stocks are saying what risk? As I write this blog, the Dow Jones Industrial Average (chart), the S&P 500 (chart), the Nasdaq (chart) and the small-cap Russell 2000 (chart) once again are all approaching all time highs. This after a very modest pullback in August. So Wall Street continues to remain in the “buy the dip” mood. All year long and every single time stocks experience any type of pullback, buyers come in and lift the markets to all time highs.

How long can this last? From a technical standpoint the key indices remain below the 70 value level of the relative strength index also referred to as the RSI. The RSI is used as a gauge by certain market technicians to see if whether or not stocks in the short term are overbought or oversold. As as these indexes approach all-time highs and should they breakthrough those highs, these markets can and should continue to go higher. However, if they do not breakout here, then one could expect yet another pullback especially as we are now in one of the more underperforming months for equites of the year. Historically September and October for that matter tends to be a difficult time for the markets. However, based on what we have witnessed all year long despite the ongoing geopolitical risks and with interest rates on the rise, the markets may not care about the seasonality trends of September and October. Good luck to all and both Paula and I wish everyone a safe and relaxing Labor Day Weekend 🙂

~George

Gold chart - Paula Mahfouz

Dow 22,000 In Sight…

The Dow Jones Industrial Average (chart) closed the month of July at a record high and came within 70 points of the 22,000 mark. Just a few short months ago that the Dow surpassed the 21,000 milestone. What an incredible run in such a short period of time! Not only is the Dow Jones Industrial Average (chart) notching new record highs almost daily, the Nasdaq (chart) last Thursday posted a new record at 6460, as did the S&P 500 (chart) setting a new record of 2484. Last but not least, the small-cap Russell 2000 (chart) also set a new record last week of 1452. However, both the Nasdaq (chart) and the small-cap Russell 2000 (chart) have reversed their upward trajectory over the last few trading sessions in a noticeable manner. Let’s keep an eye on this development.

I think it is safe to say that Q2 earnings reporting season has helped fuel the Dow Jones to new record highs as well as the S&P 500. Tech stocks have been reporting a mixed bag so far this earnings reporting season which is why that index has started to abate a bit. All eyes today are on Apple (NasdaqGS: AAPL) which report their earnings results after the close. This could be the one stock that either reverses the latest mini-downward trend in the Nasdaq or for that matter, accelerate it. As I look to the technical shape of the the aforementioned indexes, only the Dow Jones Industrial Average (chart) is on overbought territory, while the S&P 500 (chart), Nasdaq (chart) and the small-cap Russell 2000 (chart) have begun their reversion to the mean and are all approaching the 50 value level of the relative strength index.

Game plan for August? Personally, I think it is time to reduce long exposure to equities due in part to this startling run stocks have had all year long. This coupled with the month of August being an historically weak month for equities could create the perfect set up for the much anticipated market correction that the bears have been waiting on. That said, I have to remind myself that there has been no such thing as typical in these markets for we have been in unchartered territory for a long period of time. One final note, it is always recommended to consult with a certified financial planner before making any adjustments to your portfolio.

Good luck to all 🙂

~George


Simply On Fire!

Stocks continue to set records and now on a daily basis! As I am writing this blog the Dow Jones Industrial Average (chart) is now trading north of 20440, the S&P 500 (chart) is trading well above 2300, the Nasdaq (chart) is trading above 5750 and the small-cap Russell 2000 (chart) set an all time high yesterday at 1398! I continue to be amazed on how resilient the markets have been and continue to be. Earlier this month it appeared that the Trump rally stalled out and it was becoming a wait and see environment. Well now the Trump rally has seemingly reignited. Trump last week announced he has major news forthcoming on his tax plan and that was apparently the cue for the markets to rally yet again. However, one has to ask how many more tweets, news conferences or headlines can take the markets higher? Without question the above key indices are becoming overbought and especially pertaining to the relative strength index also know as the RSI. Let’s take a look.

Currently the Dow Jones Industrial Average’s RSI (chart) is trading at a 73, the S&P 500 (chart) RSI is also currently at 73, the Nasdaq (chart) is even higher at 77. The only laggard pertaining to the relative strength index and being in an “overbought” condition is small-cap Russell 2000 (chart) in which its RSI is currently at the 60 value level. Remember the relative strength index is a widely utilized technical indicator that certain institutional traders include in their models along with a variety of algorithm trading platforms. The RSI is a momentum indicator that tracks the size of gains and losses over a given period of time with the 70 value level and above as overbought and the 30 value level and below as oversold. One of the concerns certain market technicians have is that these all time highs and overbought conditions have been occurring on relatively light volume. Without trying to call a top here, I suspect that the aforementioned indices and some of the overbought stocks within these indexes are due for a pullback.

Good luck to all and Paula and I wish everyone a Happy Valentine’s Day 🙂

~George


Earnings Take Center Stage…

Earnings reporting season begins in earnest this week which could play a role in determining whether or not the bull market has more room to run. This past Friday the money center banks kicked off the reporting season as JP Morgan Chase (NYSE: JPM) and Bank of America (NYSE: BAC) recorded eye popping profits while Wells Fargo (NYSE: WFC) continues to deal with the aftermath of the “fake-accounts” debacle that rocked the bank last year.

As I look at the charts of the key indexes, I do see a potential technical catalyst looming. The Dow Jones Industrial Average (chart), the S&P 500 (chart) and the small-cap Russell 2000 (chart) all share similar and current chart patterns. Over the past month or so, these key indices have been consolidating and trading in a tight range and when you have a looming catalyst such as earnings reporting season, most likely this pattern will breakout or breakdown. The Nasdaq (chart) does not fit this consolidation profile yet as it has been making new highs and leading the pack so far this year. Another technical set-up I look for is overbought or oversold conditions. Seemingly we have been in overbought conditions since the election but technically we are not according to the relative strength index also known as the RSI.

In my previous blog I did write about my expectation of increased volatility as we headed into January and earnings reporting season and how to hedge yourself against such volatility. To my surprise, vol has remained relatively low so far, however, there are catalysts looming as described above. As far as protecting a portfolio against any future volatility, there are many ways to do so but the most effective and simplest way is to buy S&P 500 puts. Especially while vol is low and premiums are relatively cheap. So if you have a “long only” portfolio buying some protection in the form of S&P 500 put options might not be a bad idea. Of course it is always best to consult a certified financial planner(s) before making any investment decisions or any adjustments to your current portfolio. My goal is to bring light to strategies that can be helpful to you that certain managers might not cover.

Good luck to all 🙂

~George


Is It Time For A Breather?

Stocks have been on a tear since the end of June with the key averages gaining close to 10% or more since coming off of their late June lows. That’s right double digit gains in a little over a month lead by the Nasdaq (chart) which is almost up 13%, followed by the small-cap Russell 2000 (chart) up 12.35% and both the S&P 500 (see chart below) and the Dow Jones Industrial Average (see chart below) closing up nearly 10% in that same time period. Part of the reason why the tech focused Nasdaq has led the charge is the stronger than expected and recently announced quarterly earnings results out of Amazon (NasdaqGS: AMZN) Apple (NasdaqGS: AAPL), Facebook (NasdaqGS: FB) and Google aka Alphabet (NasdaqGS: GOOGL).

So the question now is after such dramatic double digit gains in the aforementioned indices and in such a short period of time, is it time for a pause and/or a retracement? As you all know by now, the first thing that I look at when it comes to accelerated gains in any stock or index is the relative strength index also known as the RSI. The relative strength index is a technical indicator to determine overbought or oversold conditions, click here  for the complete definition. The RSI is also one of the favorite technical indicators used by market technicians, certain money managers and even select algorithms have the RSI programmed into their model. That said, the Nasdaq has now hit the 70 value level of the RSI which is an overbought level according to the RSI while the other key indices are not too far behind. Please note that indexes and stocks can remain overbought for extended periods of time.

So what does all of this mean? Well I think the set-up now is a little spooky. Not only are we at or approaching overbought conditions according to the relative strength index, but we now find ourselves in the month of August. August historically tends to be one of weakest month of the year for equities. In fact, over the past seven years the key indexes have fallen each year during this time period. History doesn’t always have to repeat itself, but the current set-up bodes well for a softer month ahead. We will see. Good luck to all 🙂

~George

S&P 500 George Mahfouz Jr

Dow Jones Chart George Mahfouz Jr

Rate Hikes Are Looming…

Janet Yellen the chair of the Federal Reserve last Friday signaled that the Federal Reserve is prepared to raise interest rates in the coming months should the U.S. economy continue to improve. Some pundits suggest that a rate hike could come at the Fed’s next policy meeting in two weeks. Despite the rate hike chatter, the markets continue to shrug off what seemingly could be bearish for stocks. The Dow Jones Industrial Average (see chart below) is within striking distance of all time highs. Same can be said for the S&P 500 (see chart below), the Nasdaq (see chart below) finds itself flirting once again with the 5000 mark and the small-cap Russell 2000 (see chart below) appears to have caught a bid and is strengthening.

This type of market activity is counterintuitive when interest rates appear to be heading north. The flip side to this thinking is if the Federal Reserve is willing to raise rates due to a stronger economic back-drop, one can assume that this must be good for corporate America. Logically speaking I agree, however, if history has anything to do with the markets, a rising interest rate environment typically does not bode well for equities. Couple this with the seasonality of the summer months which tend to be weaker months for stocks and the upcoming fall presidential election, and I would say at the very least we will see a rise in volatility. These are very powerful forces that are lining up and I think it’s safe to say the markets will be very reactive to these events.

So what’s a trader or investor do in this landscape? For me personally I think the type of environment we are heading into creates opportunity on the long and short side. I will be paying close attention to overbought and oversold conditions of the markets and select equities throughout the summer and into the fall. As everyone knows by now my favorite technical indicator when it comes to spotting overbought/oversold conditions is the Relative Strength Index also known as the RSI. Many market technicians also favor this technical indicator when assessing market conditions from a technical standpoint. Over the years the RSI has demonstrated its usefulness and if you are not familiar with this technical indicator, you may want to research it out. Click here for starters.

Both Paula and I wish everyone a very safe, prosperous investing and trading summer 🙂

~George Mahfouz, Jr.

Screen Shot 2016-05-30 at 8.00.40 PMGeorge Mahfouz Jr. S&P 500 chartGeorge Mahfouz Jr. Nasdaq ChartGeorge Mahfouz Jr. Russell 2000 Chart


Retail Stocks Retreat!

So does this mean the consumer have closed their wallets? The SPDR S&P Retail ETF (Symbol: XRT) which has over 500M in net assets with holdings in a wide variety of the retail space has lost over 10 percent over the past few weeks with 4.4% of this sharp decline  occurring last Wednesday alone. This was the largest one day drop for this widely followed retail stock ETF in almost 5 years. Some individual retailers have even fared worst over the past month or so as their earnings reports and outlooks have been bleak to say the least. Just take a look of the charts of Macy’s (Symbol: M) and Nordstrom Inc. (Symbol: JWN) and you can see just how much these retails missed their earnings numbers and well as how they guided for the upcoming quarter and second half of the year.

No question the retail sector sell-off had an effect on the overall markets with the Dow Jones Industrial Average (chart) closing down over one percent on the week, the Nasdaq (chart) finished lower by one half of one percent, the S&P 500 (chart) closed lower by the same margin and the small-cap Russell 2000 (chart) closed the week out down over one percent.

As mentioned in my previous blog, the technical shape of the aforementioned indices appear to be breaking down and this past week did not help at all. So now it’s not just the 20-day moving averages that have been breached, each of these indexes have all now broken through their respective 50-day moving averages. What’s more, is we do not find ourselves in an oversold condition according to the relative strength index also known as the RSI. So with no real market moving catalysts this upcoming week, it is possible that the current selling pressure continues until oversold conditions occur or other support levels are hit. Good luck to all.

~George