Does It Feel A Bit Bubbly?

Do the markets feel a bit bubbly to you? This question is beginning to surface more frequently lately and I think it’s a great question to be asking. The majority of asset classes seemingly have gone straight up without pause over the past several months. Whether it’s the stock market as a whole, the crypto space or one of the hottest trends lately are SPAC’s. What is a SPAC? A SPAC is a special purpose acquisition vehicle that is publicly traded but has no assets other than cash. These vehicles are specifically designed to form as a public company, raise capital and then seek out companies to acquire. For example the electric vehicle space has been one of the favorite sectors for SPAC’s to target over the past year. This is a much easier pathway for private companies to go public without having to go through the time and expense of a traditional IPO.

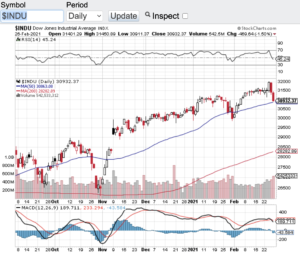
One of the problems that is happening with the SPAC trade is once they identify a target and move to acquire it, the valuations of these SPAC’s begin to rise steadily into the nosebleed section of the markets. So much speculation is occurring with these SPAC’s institutional and retail investors are willing to pay essentially any price to get on board. Let’s not forget about the day traders that add fuel to the rise in these SPAC’s. So between all of the above and now with interest rates starting to tick up, it’s now wonder we have witnessed over a 1000 point drop in the Dow Jones Industrial Average (see chart here) to close out last week. Now let’s look at the technical shape of the major averages.

The Dow Jones Industrial Average (see chart below), the S&P 500 (see chart here), the Nasdaq Composite (see chart here) and the small-cap Russell 2000 (see chart here) over the past few trading sessions have all dropped below their respective 20-day moving averages and are finding support at their 50-day. Let’s see if these key indices can hold their 50-day moving average support zone this week. If they can the uptrend could very well remain intact, if not, we could see late last weeks selling pressure continue.

Good luck to all 🙂

~George

Does It Feel Bubbly? - Paula Mahfouz

Retail Stocks Retreat!

So does this mean the consumer have closed their wallets? The SPDR S&P Retail ETF (Symbol: XRT) which has over 500M in net assets with holdings in a wide variety of the retail space has lost over 10 percent over the past few weeks with 4.4% of this sharp decline  occurring last Wednesday alone. This was the largest one day drop for this widely followed retail stock ETF in almost 5 years. Some individual retailers have even fared worst over the past month or so as their earnings reports and outlooks have been bleak to say the least. Just take a look of the charts of Macy’s (Symbol: M) and Nordstrom Inc. (Symbol: JWN) and you can see just how much these retails missed their earnings numbers and well as how they guided for the upcoming quarter and second half of the year.

No question the retail sector sell-off had an effect on the overall markets with the Dow Jones Industrial Average (chart) closing down over one percent on the week, the Nasdaq (chart) finished lower by one half of one percent, the S&P 500 (chart) closed lower by the same margin and the small-cap Russell 2000 (chart) closed the week out down over one percent.

As mentioned in my previous blog, the technical shape of the aforementioned indices appear to be breaking down and this past week did not help at all. So now it’s not just the 20-day moving averages that have been breached, each of these indexes have all now broken through their respective 50-day moving averages. What’s more, is we do not find ourselves in an oversold condition according to the relative strength index also known as the RSI. So with no real market moving catalysts this upcoming week, it is possible that the current selling pressure continues until oversold conditions occur or other support levels are hit. Good luck to all.

~George

Is It A Looming Rate Hike, Or Something Else?

After posting blistering gains in the month of October, stocks took it on the chin last week and it’s technically looking like more short-term downside could be in the cards. For the week, the Dow Jones Industrial Average (chart) lost 665 points, the Nasdaq (chart) retraced 219 points or 4.3%, the S&P 500 (chart) -76 points and the small-cap Russell 2000 (chart) closed lower on the week by 53 points or 4.4%.

Seemingly, the start of the selling pressure accelerated when the October labor report came out surprisingly strong. This report was released on November 6th. One could say that this is the main reason stocks have been under pressure. Pundits are now calling with almost certainty that the Federal Reserve has the green light to raise interest rates at their next meeting in December. Couple this will commodity prices continuing to fall, in particular oil, which is down recently almost 10% and you can understand why the markets would be under pressure. Or could it be the simple fact that October saw almost 10% gains across the board and the key indices were overdue for a pullback. I’d like to add to the mix that the latest round of economic numbers could also be weighing in on investor sentiment. This is evidenced by a weaker than expected retail sales number and weak retail earnings reports issued last week along with a very weak Producer Price Index. Sum all of this up and it’s no wonder the aforementioned indexes closed lower by almost five percent last week. From a technical perspective the key indexes have now breached their respective 200-day moving averages and if you are bullish, you would want to see the markets recapture this key technical support line and return to the uptrend that was intact throughout the month of October.

As the Thanksgiving Day holiday fast approaches, both Paula and I wish everyone a very safe, healthy and Happy Thanksgiving 🙂

~George

Stocks Go On A Wild Ride!

As the new year begins to unfold, volatility has taken command! Yesterday, the Dow Jones Industrial Average (chart) had a 424 point intraday swing, an intraday move not seen in quite sometime. Volatility continued to surge this morning as stocks opened down sharply by weaker than expected retail sales for the month of December, and JP Morgan (NYSE: JPM) announcing weaker than expected quarterly results. So is this the new norm? Investors and especially traders have been waiting a long time to see volatility come back into the market and they may have just gotten what they have been expecting. For years, stocks have been in a low vol environment thanks in part to the Federal Reserve’s easy monetary policies. Now that those policies have and are winding down, it’s no surprise to me that volatility has picked up. Furthermore, now that we are have entered into Q4 earnings reporting season, I expect that volatility will remain elevated and possibly increase.

Companies that are scheduled to report their earnings results are over the next week are; Citigroup (NYSE: C), Intel (NasdaqGS: INTC), Goldman Sachs (NYSE: GS), Delta Airlines (NYSE: DAL), International Business Machines (NYSE: IBM), Morgan Stanley (NYSE: MS), Netflix (NasdaqGS: NFLX), American Express (NYSE: AXP), eBay Inc. (NasdaqGS: EBAY), Starbucks (NasdaqGS: SBUX), Verizon Communications (NYSE: VZ), General Electric (NYSE: GE), Honeywell International ( NYSE: HON) and McDonald’s Corp (NYSE: MCD) just to name a few.

More now than ever I will be focusing on “top-line” growth of corporate America to see if this most recent sell-off poses a buying opportunity. If the top-line of companies do not begin to grow in a meaningful way, I would expect the selling pressure to continue. Good luck to all 🙂

~George

Now That’s What I Call A Bounce!

After such a torrid bull run in 2013, where the the four major averages gained over 25%, to no great surprise, these same indexes experienced more than a 5% pullback in January and early February. However, over the past couple of weeks and true to form, these indexes not only bounced off of key technical support zones, but they also took back their 50-day moving averages. For the week, the Dow Jones Industrial Average (chart) finished up 2.28%, the Nasdaq (chart) had a gain of 2.86%, the S&P 500 (chart) +2.32% and the small-cap Russell 2000 (chart) closed the week up 2.92%. The markets responded with a roar as the new Fed chairwomen Janet Yellen, in her first public appearance at the helm of the Fed, reiterated her commitment to model after the Bernanke era monetary policies. Stocks were already recovering from the January correction but accelerated their gains as she spoke to Congress this past Tuesday. All expectations now are that stocks will remain buoyed by the continuing asset backed purchases despite the modest tapering that is now in effect.

In my previous blog I expressed concern over the technical breakdown of the markets and that the 50-day moving averages of the key indices had been breached. Furthermore, I thought there was a possibility of the 200-day being the next stop. However, I did also indicate that if the markets were able to rebound and take back their 50-day and remain above that mark, that would be a positive. This is where we find ourselves now. All of the aforementioned key indexes have traded and closed above this key technical metric. The question now becomes whether or not this slingshot bounce and break above the 50-day is sustainable? Q4 earnings reporting season really didn’t say too much about the growth of corporate America, which overall was a mixed bag at best for the majority of the sectors. Couple this with economic signs of weakness as retail sales growth still remains flatlined, and I think we will continue to experience choppy waters for stocks, and I would be surprised if we began making new high after new high like last year. That said, liquidity for stocks is seemingly plentiful and we are still in a strong seasonality period for equities, so I also wouldn’t be surprised if we stabilized above the 50-day and consolidated for an extended period of time. Unless of course there is an unexpected negative geopolitical or global macro event that creeps back into the mix, then all bets are off. I will continue to track the technicals to gauge entry and exit points while using protective stops along the way. Good luck to all and both Paula and I wish everyone a very safe and happy Presidents’ Day holiday. Please note the markets are closed on Monday in recognition of Presidents’ Day.

Have a great weekend 🙂

~George

A Mixed Bag…

At the height of Q4 earnings reporting season, results from corporate America have been conflicted, so far. Let’s start with everyone’s favorite, Apple (NasdaqGM: AAPL). Despite sales of its iPhone hitting records during the holiday season, those sales were shy of what the street was expecting by three million units. Furthermore, during the conference call after its earnings release on Monday, management projected a softer outlook for the upcoming quarter amid growing competition in the smartphone and tablet marketplace. This was enough to send Apple’s shares lower by over 10% this past week. In fact, the majority of the retailers have reported very disappointing results this earnings reporting season with the widely followed and traded retail SPDR S&P Retail ETF (NYSE Arca: XRT) (chart) down almost 10% for the month of January.

Now let’s take a look at the results of the four key indices so far this year. For the month of January, the Dow Jones Industrial Average (chart) is down 5.3%, the tech-heavy Nasdaq (chart) is off by 1.7%, the S&P 500 (chart) is lower by 3.6% and the small-cap Russell 2000 (chart) finished the month down by 2.8%. In my January 1st blog, I eluded to expecting a 5%, 10% or even a 15% correction in 2014, and we could very well be in this corrective phase as we speak. The question now to investors and traders alike is how steep could this current pullback become? Let’s not forget we are coming off of a year in which these key indexes individually gained well over 25%, with the Nasdaq leading the way gaining a whopping 38% in 2013. What I try to do is tune out all of the noise that comes out of the financial cable channels and media and focus on seasonal patterns and the technicals of the market. Technically speaking, the markets are not yet in an extreme oversold condition according to the RSI principles. Remember the Relative Strength Index a.k.a. the RSI is one of my favorite technical indicators where overbought and oversold conditions are exhibited depending on certain value levels. In this case and according to the RSI principle, the 30 value level and below is considered oversold and anything below 20 is considered extremely oversold. We are just not there yet. However, one thing I do want to highlight is for the first time in months the aforementioned key indices have all fallen and closed below their 50-day moving averages. Something that has not occurred since early October of last year and something we want to keep an eye on. If the markets cannot rise back and remain above their 50-day in the near future, the 200-day support line could be the next real support for these markets. I am not suggesting that we will test the 200-day moving average, but if this is the case, the selling pressure would most likely continue and may actually increase. Let’s see how next week’s earnings reports come in before we draw any further conclusions.

Looking ahead to next week, we will here earnings results from petroleum producer Anadarko (NYSE: APC), real estate investment trust Annaly Capital Management (NYSE: NLY), Yum Brands (NYSE: YUM), Boston Scientific Corp  (NYSE: BSX), retailer Michael Kors (NYSE: KORS), Cognizant Technology Solutions Corp (NasdaqGS: CTSH), Green Mountain Coffee Roasters (NasdaqGS: GMCR), Pandora Media (NYSE: P), AOL Inc. (NYSE: AOL), Expedia (NasdaqGS: EXPE), General Motors (NYSE: GM), Verisign Inc. (NasdaqGS: VRSN), Apollo Global Management (NYSE: APO), Flir Systems (NasdaqGS: FLIR) and Moody’s Corp (NYSE: MCO) just to name a few. So as earnings reporting season continues, so do the markets. Good luck to all.

Have a great weekend 🙂

~George