Have We Bottomed Yet?

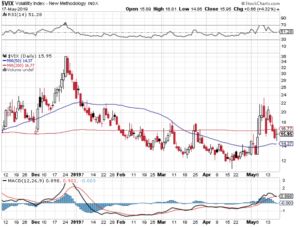
The million-dollar question that is populating the airwaves right now is “have we bottomed yet”? I think the answer lies in two things, first and foremost, the Federal Reserve and whether they will pull back some on their interest rate hikes. And the second question that comes to mind is how corporate earnings perform as this year continues to unfold. Well, the bull case is inflation will continue to ease which should slow down the Fed’s interest rate hikes. The bear case is inflation is still high and that it is going to take time for 2% inflation which is the Federal Reserve’s target. Needless to say, volatility should be in play for the foreseeable future.

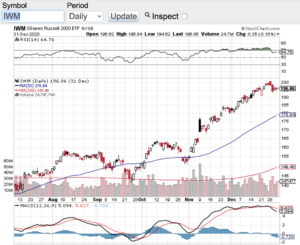
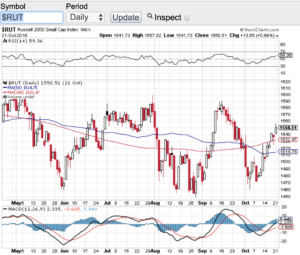
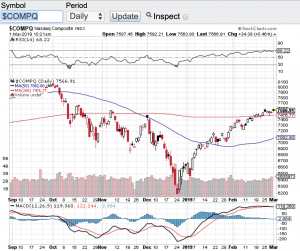
The markets did close out the month of January on a high note. Yesterday, the Dow Jones Industrial Average (see chart here) closed up 368 points closing over the 34000 level. The S&P 500 (see chart here) finished the month of January up 59 points, the Nasdaq Composite (see chart here) closed up 190 points and the small-cap Russell 2000 (see chart here) closed up 46 points on the last day of January.

Technically speaking these key indexes also appear ready to run some more. Each of these key indexes are finding support at their respective 20-day, 50-day, 100-day and 200-day moving averages. As I look at the relative strength index aka the RSI, there is yet another technical indicator that  appears to favor stocks for a continuation to the upside. After a slight retracement of the RSI there are no overbought conditions yet as defined by the RSI.

All in all, I think the stock market is performing quite well considering the headwinds that are currently present. From high inflation to corporate earnings compression, to the ongoing geopolitical backdrop, I think the bulls will take the markets performance so far this year. And as mentioned above, I would not be surprised to see volatility in stocks for the foreseeable future.

Good luck to all 🙂

~George

2021 Is Here…

2021 is here and it could not of come fast enough. Happy New Year and I think we can all use a fresh start! The year 2020 was one of the most challenging years our country and the world has faced. One of the only exceptions that did not face many challenges is the stock market. Despite the global pandemic we remain in and the non-stop chaos out of Washington DC, the major averages set record highs throughout the year. Who would of thought that stocks and market speculation would be at such a fever pitch considering the backdrop of 2020. During this latest bull market surge one thing that stands out to me is how margin debt has hit all time highs. Investors have borrowed over $700 billion dollars against their portfolios which is also a new record. This is somewhat alarming because when the market experiences a correction, margin debt can accelerate any meaningful selloff. Some investors could be forced to sell if their margin debt becomes disproportionate to their overall account value. That said, when record highs continue to be set the risk of margin debt tends to be overlooked.

Speaking of record highs, both the Dow Jones Industrial Average (see chart here) and the S&P 500 (see chart here) set new records on the last trading day of the year. The Nasdaq Composite (see chart here) and the Russell 2000 (see chart below) also set records earlier in the week. Although stocks and indexes feel overbought, we are not seeing extreme overbought conditions according the the relative strength index also know as the RSI. There is also support in place at the 20-day, 50-day, 100 and 200-day moving averages. So technically speaking the key indices appear to be in good shape. This set-up bodes well for the continuation of the market rally that we are in.

Of course there are risks out there that could temper the record setting enthusiasm. One risk in particular is the upcoming runoff election in Georgia next week. If the democrats take control of the Senate, this could be viewed as a negative for stocks. The markets historically have liked when there is a split majority between the House and Senate. Pundits argue that a Democratic President and a Democrat controlled Congress could affect income and capital gains taxes that would negatively impact stocks. I am not sure if this will play out but nonetheless as we continue down this bull market path we should not be lullabied to sleep with the risks out there. Good luck to all 🙂

~George

2021 Is Here - Paula Mahfouz

Third Rate Cut Of The Year…

The Federal Reserve provided its third rate cut of the year on Wednesday. Although this was very much expected, until it happens you don’t know. Without question the Fed’s actions this year has helped the markets hit new highs throughout the year. This week has been no different. Despite pulling back a bit yesterday the Dow Jones Industrial Average (see chart here) remains above 27000, the S&P 500 (see chart here) hit a fresh all-time high on Wednesday, the Nasdaq Composite (see chart here) is within 50 points of its all time high and the small-cap Russell 2000 (see chart below) is trading above its 20, 50, 100 and 200-day moving averages. A technically healthy sign.

What has allowed the Federal Reserve to be proactive in cutting rates is the fact that inflation is pretty much non-existent. If inflation was present in a meaningful way I am not sure the Fed would be cutting rates at all. A huge side effect to lower rates is a strong stock market. So it’s no wonder we continue to trade at new highs and at the very bare minimum hold strong near the upper bands of the trading range. A couple of other factors that are supporting the markets are the latest round of corporate earnings reports which are coming in a bit better than expected along with some positive news flow out of the China trade negotiations.

With this latest rate cut I would not be surprised to see a continuation of the current upward trend and also potentially see new all-time highs before year-end. As I look at the technical shape of the aforementioned indexes pertaining to the relative strength index and the moving averages, I don’t see any issues there either. The Dow Jones Industrial Average (chart), the S&P 500 (chart), the Nasdaq Composite (chart) and the Russell 2000 (chart) are all above their respective moving averages which historically provides support on pullbacks and none of these indexes are in overbought territory  according to the relative strength index (RSI) principles.

Good luck to all 🙂

~George

Third Rate Cut Of The Year - Paula Mahfouz


The T-Word Has Done It Again!

No question the T-word has done it again aka tariffs. The week started off with China’s retaliation to the Trump tariffs with a market sell-off on Monday sending the Dow Jones Industrial Average (see chart here) down 600 points. The trade war also sent volatility soaring earlier in the week as well $VIX (see chart below). This after the market set all-time highs. No matter what the case is, stocks will continue to sell-off on any negative tariff news. Why not? Tariffs can essentially act as a tax on American businesses and the consumer at least in the short term.  Without question the tariff tape bombs have hit the market and had nearly doubled the price of vol over the past week or so. (see chart here) 

Now that the wild market swings are back, what’s next? Whenever I see a pick up in vol I take a closer look at the technical shape of the key indexes. Let’s start with the Dow Jones Industrial Average (see chart here). Since volatility kicked back in the Dow Jones Industrial Average lost around 1000 points, but found support at its 100 and 200-day moving averages and bounced off of those key support levels. The S&P 500 (chart) also sold off sharply over the past week or so but it too bounced off of key support zones. The Nasdaq Composite (chart) sold off almost identical to the S&P and bounced back nicely.  Last but not least, the small-cap Russell 2000 (chart) actually fell through its 200-day moving average and found support at its 100-day. So technically speaking and if you are in the bull camp this is a very good sign for the continuation of the latest upward trend in the market. I am always a fan of pullbacks that meet support, holds that support and resumes its uptrend and that’s what we seemingly have now.

Let’s see if we get any positive developments on the trade war to calm the markets down a bit. Good luck to all 🙂

~George

$VIX - george mahfouz

Best Start Of The Year In Decades!

Stocks have opened the month of March rip roaring again adding to the best start of the year for the averages in decades. The Dow Jones Industrial Average (see chart here) opened the trading day up over 200 points, the S&P 500 (see chart here) opened up over 20 points, the Nasdaq Composite (see chart below) opened up over 55 points and the small-cap Russell 2000 (see chart here) opened up over 11 points. These gains are adding to the double digits percentage gains the markets have already realized in 2019.

So why such a strong start to the year? I am not trying to sound like a broken record but this 10 year long bull market is a head scratcher.  No matter what has been thrown at one of the longest bull markets in history, nothing seems have an adverse affect. You name the crises and stocks shrug it off. Whether it is a geopolitical event, the Federal Reserve raising rates or the daily chaos that comes out of Washington, nothing has disrupted this incessant rise in stocks. We did get a definitive correction late last year in where the bears came out of hibernation and predicted the end of the bull market and that a 40% correction is now imminent. Well don’t look now but we are not too far off from setting new all time highs in the aforementioned indexes.

Technically speaking it appears that the coast is clear for now as well. All of the major averages are now trading above their respective 20-day, 50-day and 200 day moving averages which is a very bullish sign. The one caveat to the technical shape of the market is that stocks are a bit overextended. Overbought conditions do exist technically and according to the relative strength index also known as the RSI. That said, the pullbacks that do occur continue to be met with support with buyers stepping in willing to add to their existing positions or open up new positions. The trend remains your friend in our current environment. Good luck to all 🙂

~George

Nasdaq Composite - Paula Mahfouz

Earnings Take Center Stage…

Earnings reporting season begins in earnest this week which could play a role in determining whether or not the bull market has more room to run. This past Friday the money center banks kicked off the reporting season as JP Morgan Chase (NYSE: JPM) and Bank of America (NYSE: BAC) recorded eye popping profits while Wells Fargo (NYSE: WFC) continues to deal with the aftermath of the “fake-accounts” debacle that rocked the bank last year.

As I look at the charts of the key indexes, I do see a potential technical catalyst looming. The Dow Jones Industrial Average (chart), the S&P 500 (chart) and the small-cap Russell 2000 (chart) all share similar and current chart patterns. Over the past month or so, these key indices have been consolidating and trading in a tight range and when you have a looming catalyst such as earnings reporting season, most likely this pattern will breakout or breakdown. The Nasdaq (chart) does not fit this consolidation profile yet as it has been making new highs and leading the pack so far this year. Another technical set-up I look for is overbought or oversold conditions. Seemingly we have been in overbought conditions since the election but technically we are not according to the relative strength index also known as the RSI.

In my previous blog I did write about my expectation of increased volatility as we headed into January and earnings reporting season and how to hedge yourself against such volatility. To my surprise, vol has remained relatively low so far, however, there are catalysts looming as described above. As far as protecting a portfolio against any future volatility, there are many ways to do so but the most effective and simplest way is to buy S&P 500 puts. Especially while vol is low and premiums are relatively cheap. So if you have a “long only” portfolio buying some protection in the form of S&P 500 put options might not be a bad idea. Of course it is always best to consult a certified financial planner(s) before making any investment decisions or any adjustments to your current portfolio. My goal is to bring light to strategies that can be helpful to you that certain managers might not cover.

Good luck to all 🙂

~George


Finally The Bulls And Bears Got What They Wanted!

A Correction! After years of not having a 10% or more correction in the markets and with August tending to be one of the worst performing months for equities, this was the perfect set-up for the long overdue correction in stocks to take place. However, just as fast as the stock market correction occurred, the ensuing snap back rally was equally eye-poping. For the month, the Dow Jones Industrial Average (chart) fell 6.57%, the tech focused Nasdaq (chart) lost 6.86%, the S&P 500 (chart) -6.26% and in the month of August the small-cap Russell 2000 (chart) experienced a 6.45% decline. Last week we did witness very rare market behavior with whipsaw action not seen since the 2008 financial market crisis. This brought back memories of how stocks and financial markets can irrationally behave as emotions and high frequency trading take over.

The question now is, is this type of market volatility over? I don’t think so. Let’s first take a gander of the technical health of the four major averages. Without question, short term technical damage in these key indices have occurred. Each one of the index have fallen sharply and have closed below their respective 200-day moving averages. Furthermore, today at the open and for the first time in years, the S&P 500 (chart) will have its 50-day moving average crossover its 200-day moving average. Technically and historically speaking, this is not usually a good thing. The Dow Jones Industrial Average (chart) saw its 50-day crossover its 200-day in the middle of August only to experience exhaustive selling thereafter. The good news technically is that stocks had been way oversold to the point 0f capitulation. Hence, the ensuing sharp rally from the most recent lows.

So where do we go from here? I suspect that we will continue to experience outsized market moves in both directions and trading this kind of market environment is not for the feint of heart. I revert back to a more conservative approach starting with identifying the most current “best of breed” in their respective industries. The first prerequisite for me in identifying potential investment candidates in this type of market environment is for companies to have pristine balance sheets with little to no debt levels. However, if they do have debt they must have have historic and current cash flows that can easily service their debt. Without this and in today’s market I have no interest on really owning anything. Of course there are many other metrics that do apply but for me personally the balance sheet is where it begins. Another huge factor for me especially today is to implement disciplined  “protective stops” in any positions I hold. This ensures that your portfolio is somewhat protected should the markets decide that we are in the early innings of this correction. With that said and especially in today’s market, please consider consulting with a trusted certified financial planner(s) before making any additions or modifications to your own portfolio.

Both Paula and I wish everyone a very safe and Happy Labor Day holiday weekend 🙂

~George


A Weak Week For Stocks…

Stocks closed out the final week of May on a softer note with the Dow Jones Industrial Average (chart) falling 221.34 points, the Nasdaq (chart) lost 19.33 points, the S&P 500 (chart) -18.67 points and the small-cap Russell 2000 (chart) closed the week lower by 5.69 points. Considering the record closing highs that have been set over the past month or so, its no surprise that equities took a bit of a breather.

Now that we are in the month of June, let’s see if this seemingly temporary pause turns into something more meaningful. The month of June historically is a unfavorable month for stocks and this year may be no different. In fact, in this trading week headline risks are abound. Internationally speaking, without a doubt Greece’s debt talks will continue to grab the attention of investors this week as well as the ECB’s central bank meeting. Here in the states, traders will continue to pay attention to the continuing strength of our dollar as well as May’s jobs report at the end of the week. As you can see there are plenty of catalysts that could become market moving events.

Technically speaking, the aforementioned indexes are finding support at their respective 50-day moving averages and none of these indices are in overbought or oversold territory according to the relative strength index (RSI). One technical point I do want to make is when stocks were setting records earlier in May, the volumes associated with those records were on the lighter side. As mentioned in my previous blog, my preference would of been to see these records being set with much stronger volume.

Have a great week and good luck in the month of June 🙂

~George

A Fresh Record High For The S&P 500!

It took a bit over a month since its last record closing high, but the S&P 500 (chart) on Friday indeed finished the week at a new record close of 2096.99. The Dow Jones Industrial Average (chart) closed above 18000 for the first time since the end of December as well. The tech-heavy Nasdaq (chart) now seems to be poised to go back through the 5000 mark, a level not seen since early 2000, and the small-cap Russell 2000 (chart) also closed at a record high at 1223.13.

Furthermore, both the S&P 500 (chart) and the Russell 2000 (chart) have technically broken out and could continue to notch further gains. This analysis is supported in part because both of these key indices have not yet reached overbought territory according to the Relative Strength Index/RSI. Remember, the RSI indicator signifies the 70 value level as an overbought condition for any given equity or index. The Relative Strength Index of the S&P (chart) and Russell (chart) are currently sitting around the 60 value level. So technically speaking and at least according the RSI, overbought conditions are not yet present.

With records being posted and breakouts occurring, is the economy or corporate profits really that good? Or is this a continuation of easy monetary policies worldwide? If I was a betting man, I would bet the latter. That said, how in the world can you go against the central bankers from around the world? I think the bulls will remain in charge for the foreseeable future, unless some unforseen catastrophic geopolitical event occurs.

Happy Presidents’ Day to all 🙂

~George

Are You Kidding Apple?

A $74.6 billion dollar quarter! Simply breathtaking! Apple also generated a record net profit of $18 billion, the highest quarterly net profit ever, for any company. Earnings reporting season is in high gear and no one so far have remotely come close to such an impressive performance. Congratulations Apple! That said, the overall market in the month of January did not fare as well. For the month, the Dow Jones Industrial Average (chart) lost 3.7%, the Nasdaq (chart) pulled back 2.1%, the S&P 500 (chart) retraced 3.1% and the small-cap Russell 2000 (chart) closed the month of January off 3.3%. Note that the majority of the monthly losses occurred in the past trading week. January also experienced a spike in volatility with the CBOE Market Volatility Index also known as the VIX (chart) closing just a tad under 21. The VIX is referred to as the “fear gauge” which shows the market’s expectation of upcoming volatility by calculating implied volatilities of both calls and puts of S&P 500 index options.

Technically speaking, the above key indices are fast approaching their respective 200-day moving averages, especially the Dow Jones Industrials (chart). Remember, the moving averages is amongst the most favorite technical indicator utilized by market technicians, computerized trading models and institutional investors alike. Furthermore, the relative strength index  of the aforementioned key indices are not in oversold conditions. The RSI is another favorite technical indicator of certain market technicians . So should the markets continue to experience an increase in volatility, the 200-day moving average should provide meaningful support as long as earnings reporting season closes out on a high note. I will monitor the technicals of the markets closely and wait to see how the balance of Q4 earnings reporting season plays out. If we test the 200-day moving averages and hold that level, and if earnings continue to come in positively, I would be then be inclined to become more bullish on equities. However, if we breakdown technically and if corporate America begins to show signs of slower growth, we will then be having a different discussion. Good luck to all!

Paula and I wish everyone a Happy Super Bowl Sunday 🙂

~George