Will It Hold?

As the markets closed out the month of February, the major averages are approaching a key technical point and the question now becomes, will it hold? As stocks continue to exhibit volatility the major averages are now approaching their 200-day moving average. Institutional investors, hedge funds and  individual investors view the 200-day moving average as a key support technical indicator. Historically when indexes or individual stocks gravitate to their 200-day support level at minimum some sort of bounce occurs from this key support line. If you go back over time whether it’s months or years and look at what happens when stocks or indexes retrace to their 200-day, this will demonstrate how powerful this support line can be. Now there is no guarantee that the 200-day will hold every time and reverse its course but see for yourself how this dynamic historically performs.

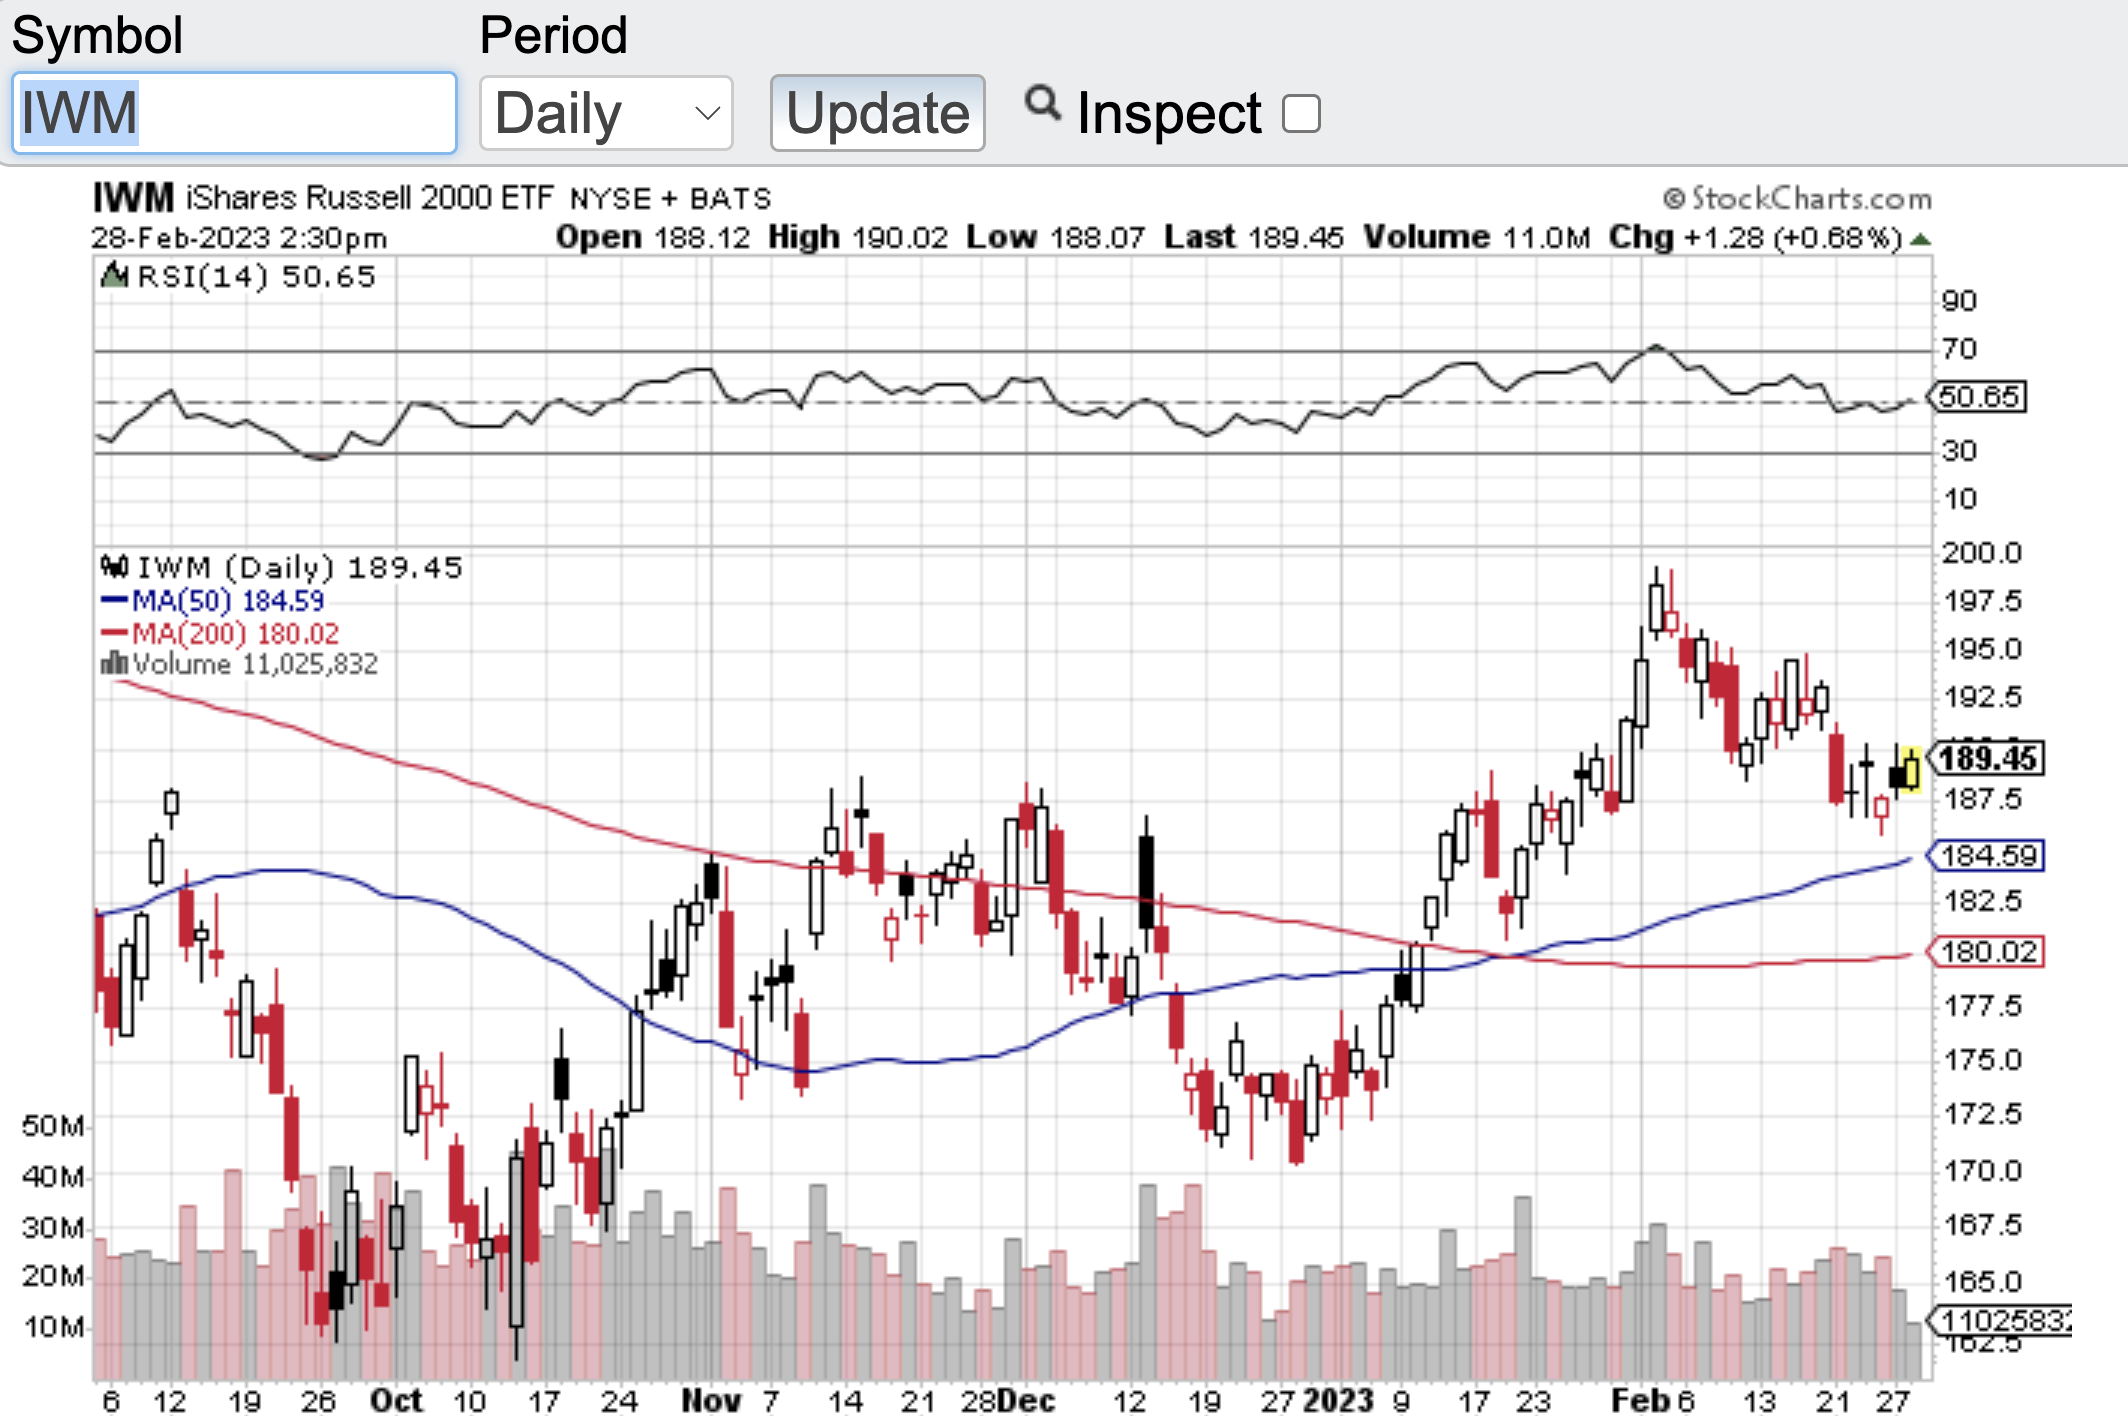
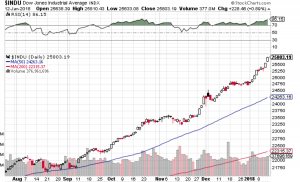
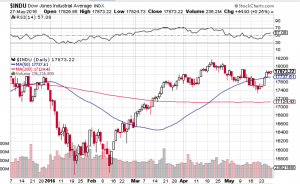
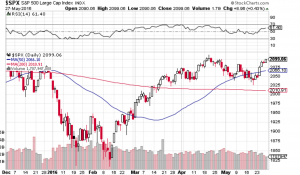
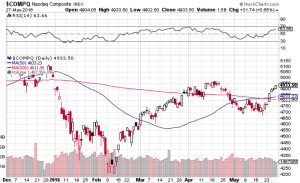
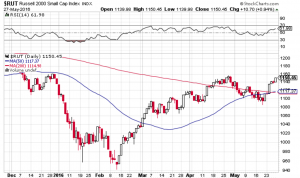
The Dow Jones Industrial Average (see chart here) is in striking distance of its 200-day moving average which is currently at the 32355 level. The S&P 500 (see chart here) is only about 90 points away from its 200-day. The Nasdaq Composite (see chart here) almost touched its 200-day yesterday and the small-cap Russell 2000 (see chart here and below) is currently further away from its 200-day compared to the Dow Jones, Nasdaq Composite, and the Russell 2000. So technically speaking the small caps are currently in a better technical set up vs the other major averages.

As far as what to expect here in March, I think things will continue to be a bit choppy and should the indexes continue to retrace and end up at or near their 200-day moving average, let’s see how this technical indicator responds should it get there. As always, please consult with certified financial planners before you make any moves or adjustments in your portfolio.

Good luck to all 🙂

~George


1000 Points In 7 Trading Days?

I am not even sure what to say here, almost 1000 points in 7 trading days? After closing above the 25,000 mark for the first time ever on January 4th, the Dow Jones Industrial Average (see chart below) is now closing in on the 26,000 mark in a matter of days. I simply do not understand how this bellwether index can notch 1000 point gains in such a short period of time. In fact most of the major averages are continuing to set records almost daily. How long can this go on? Without question we are on the brink of the strongest bull market in recorded history. The Dow Jones Industrial Average (chart) closed the week at a record 25,803.19, the S&P 500 (chart) closed at a record 2,786.24, the Nasdaq Composite (chart) closed at a record high of 7,261 and the small-cap Russell 2000 (chart) closed the record setting week at 1,591.90. The market was boosted on Friday in part by the strong quarterly earnings results of JP Morgan Chase.

Speaking of earnings reporting season, this week truly is the start of earnings reporting season in which most analysts expect strong top and bottom line growth from corporate America. Over the past few years the markets did witness strong bottom line growth in which a lot of that growth was due to improved efficiencies and reductions of the workforce. Now the opposite is occurring. The economy is expanding as is the job market. This should bode well for not only company earnings but for the continuation of the bull market. That said, I would think that a pullback of any kind is in the cards and I would also expect that investors and traders would be there in support of a retracement.

From a technical point of view equites are clearly overbought according to the relative strength index also referred to as the RSI. However, this favorite technical indicator has not provided the guidance and reliability as it usually does simply because these markets have remained overbought for one of the longest stretches I can remember. There will be a time where the RSI will become more reliable as it once was, but in my humble opinion you will need a “normal” market environment for this to be the case. Good luck to all 🙂

~George

dow jones - george mahfouz jr

Rate Hikes Are Looming…

Janet Yellen the chair of the Federal Reserve last Friday signaled that the Federal Reserve is prepared to raise interest rates in the coming months should the U.S. economy continue to improve. Some pundits suggest that a rate hike could come at the Fed’s next policy meeting in two weeks. Despite the rate hike chatter, the markets continue to shrug off what seemingly could be bearish for stocks. The Dow Jones Industrial Average (see chart below) is within striking distance of all time highs. Same can be said for the S&P 500 (see chart below), the Nasdaq (see chart below) finds itself flirting once again with the 5000 mark and the small-cap Russell 2000 (see chart below) appears to have caught a bid and is strengthening.

This type of market activity is counterintuitive when interest rates appear to be heading north. The flip side to this thinking is if the Federal Reserve is willing to raise rates due to a stronger economic back-drop, one can assume that this must be good for corporate America. Logically speaking I agree, however, if history has anything to do with the markets, a rising interest rate environment typically does not bode well for equities. Couple this with the seasonality of the summer months which tend to be weaker months for stocks and the upcoming fall presidential election, and I would say at the very least we will see a rise in volatility. These are very powerful forces that are lining up and I think it’s safe to say the markets will be very reactive to these events.

So what’s a trader or investor do in this landscape? For me personally I think the type of environment we are heading into creates opportunity on the long and short side. I will be paying close attention to overbought and oversold conditions of the markets and select equities throughout the summer and into the fall. As everyone knows by now my favorite technical indicator when it comes to spotting overbought/oversold conditions is the Relative Strength Index also known as the RSI. Many market technicians also favor this technical indicator when assessing market conditions from a technical standpoint. Over the years the RSI has demonstrated its usefulness and if you are not familiar with this technical indicator, you may want to research it out. Click here for starters.

Both Paula and I wish everyone a very safe, prosperous investing and trading summer 🙂

~George Mahfouz, Jr.

Screen Shot 2016-05-30 at 8.00.40 PMGeorge Mahfouz Jr. S&P 500 chartGeorge Mahfouz Jr. Nasdaq ChartGeorge Mahfouz Jr. Russell 2000 Chart


Global Concerns Give Markets A Pause…

Stocks had a very volatile week as tensions elevated in Ukraine and now China has seemingly hit a soft patch in its economy. For the week, the Dow Jones Industrial Average (chart) fell 2..35%, the Nasdaq (chart) gave back 2.09%, the S&P 500 (chart) -1.96% and the small-cap Russell 2000 (chart) ended the week lower by 1.82%. I do not think the most recent retreat in stocks is anything beyond the current global headline risks as our own economy appears to be intact and growing, albeit modestly. Some economists believe China will maintain a 7.5% growth rate this year while other pundits believe a cooling off of China’s economy would affect our markets here. Should the latter be the case, I would assume the Chinese government would take measures to help prop up their economy by injecting enough stimulus to ensure the targeted 7.5% growth rate for 2014 would not be breached. Recently, the economic numbers across the board coming out of China has been weaker than expected, especially in the manufacturing and export sectors.

This past week also saw an escalation in the crisis in Ukraine with both sides increasing the chatter about a potential military conflict as protests have become extremely violent. Governments from around the world are now are attempting to assist in the negotiations with Russia and Ukraine to formalize some type of accord. So it’s no surprise that a “risk off” mentality has come into the markets for the time being. I do believe that once things settle down in the Ukraine and the China headlines become less frequent, we could consolidate here for a bit as the first quarter of the year winds down. Then of course as we enter into April, all eyes will be watching how corporate America fared during the first quarter as Q1 earnings reporting season will begin. Between now and the end of March, I will be paying closer attention to our own economic data which will most likely translate into companies Q1 earnings reports.

Technically speaking, the Dow Jones Industrial Average (chart), the Nasdaq (chart), the S&P 500 (chart) and the Russell 2000 (chart) all appear to be heading towards their respective 50-day moving averages, in fact the Dow (chart)  actually breached its 50-day on Friday. The 50-day moving average is a technical indicator I favor as do other certain market technicians. Historically, when stocks or indexes reach their 50-day or 200-day moving average for that matter, support is typically found and a reversal of the stock or index ensues. The moving averages are also followed by certain institutional investors and select computerized algorithmic trading models, which could also be a reason why the moving averages can act as a support mechanism. Now I am not suggesting that the moving averages are infallible, I personally utilize this indicator mainly from a technical standpoint to help me navigate current market opportunities. Good luck to all.

Have a great weekend 🙂

~George


Happy New Year!

If 2014 comes anywhere near the performance the overall markets experienced last year, once again the bulls will be popping champagne. For the year 2013, the Dow Jones Industrial Average (chart) closed up a breathtaking 26.5%, the Nasdaq (chart) finished the year up a staggering 38%, the S&P 500 (chart) booked a spectacular gain of almost 30% and the small-cap Russell 2000 (chart) soared 37%. I think it’s safe to say that an exact repeat of 2013’s performance is highly unlikely, but there is seemingly no reason to believe that this momentum won’t continue into the new year. Even the key indices in Europe had very impressive double digit gains in 2013 with the German DAX index leading the way surging 26% on the year.

With that said, the first thing that pops out to me is that the aforementioned key indices are all now near or completely in overbought territory according to the Relative Strength Index (RSI) technical indicator. We have been monitoring these indexes since October of 2013 to see when they may go into extreme overbought conditions and with the powerful year end close, we now have 3 of the 4 key indexes officially in overbought territory with the Russell 2000 (chart) only a few value points to go. So what does this all mean for the investor or even more so, to the trader? By now all of you know that I personally view the RSI as a reliable technical indicator distinguishing whether an index or stock for that matter is overbought or oversold. In fact, certain computer algorithmic trading models are designed to act whenever extreme conditions occur in a given market or stock. Let’s recap the definition of the Relative Strength Index or the RSI. In the most simplest terms, the RSI is designed to demonstrate whether or not an index or equity is overbought or oversold, depending on certain value levels. According to the RSI principle, the 70 value level or greater, is an overbought condition and the 30 value and below is an oversold condition. And as mentioned the majority of the key indices along with dozens of stocks are now in overbought territory. This doesn’t mean that we will all of a sudden see a dramatic turn in the opposite direction, however, typically when stocks or indexes are in overbought or oversold conditions such as they are now, at some point in time, a change of direction ensues.

The wild card that will most certainly continue to play out is of course the Federal Reserve and what course of action they will take and uphold in 2014. Especially now that the Fed has started to reduce its asset purchases. We all know that the accommodative policies of the Fed over the past few years has placed a floor under these markets and whenever any attempt of a pullback or mini-correction has occurred, that condition has been met with unprecedented support, hence new market highs followed. I would expect as long as the Fed continues to support the bond and mortgage backed securities markets, even at a reduced rate, whatever pullbacks or retracements that do occur, buyers will be anxiously awaiting to add to their positions or open new ones.

I do expect a healthy 5%, 10% or even 15% correction in 2014 and if you have the gumption to go short, this could serve you well. Of course no one knows if or when this correction may take place, however, as highlighted, we are now in overbought territory which could be one of the catalysts to prompt a pullback or even a subtle correction. Should we get this healthy correction, we will be looking into the financial and technology sectors to identify opportunities to capitalize on. Please note this is not a recommendation to go short or long any asset or index, and it is prudent to consult with a certified financial planner(s) before making any investment decisions.

Good luck to all and both Paula and I wish everyone a very safe, prosperous and Happy New Year 🙂

~George