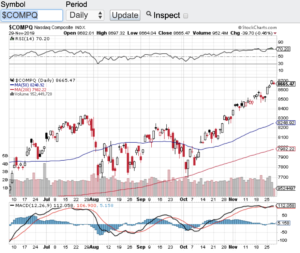
The Bounce Was Indeed Real…

In my November 1st blog, I asked the question was the bounce real? Fast forward to today and indeed the bounce the markets experienced in the early fall not only held but took off to and are nearing all-time highs. The Dow Jones Industrials (see chart here) closed yesterday at 36,245, the S&P 500 (see chart here) closed at 4,594 the Nasdaq Composite (see chart here) closed at 14,305 and the small-cap Russell 2000 (see chart here) finished the month out at 1,862.

It’s truly incredible to see how resilient the markets are considering the current interest rate environment and how inflation continues to impact the consumer. Rising interest rates tend to impact the stock market negatively and inflation impacts the consumer negatively too. So why are the markets approaching all-time highs? Could it be that the economy grew at a faster rate in the 3rd quarter than previously reported? Or could it be that the Federal Reserve may be ready to slow down or pause its current interest rate policy? I am not sure on either front, but what is apparent is that the markets are brushing off the current backdrop of Fed’s economic policy and the ongoing inflationary pressures. One thing I have learned over the years is the trend is your friend and these markets continue to trend up.

That being said, let’s look at a key technical indicator that many traders and investors rely on to see if we are approaching or at overbought conditions. According to the Relative Strength Index aka the RSI both the Dow Jones Industrial Average (see chart here) and the S&P 500 (see chart here) have crossed and are trading above the 70 value level. The 70-value level according to the relative strength index is the beginning of overbought conditions. The Nasdaq Composite (see chart here) and the Russell 2000 (see chart here) are fast approaching the 70-value level. I do want to point out that stocks and indexes can remain overbought for extended periods of time, but I would not be surprised if we see somewhat of a pause or possibly a reversal here in the month of December to this very impressive rally we are currently in.

It’s always a good idea to consult a certified financial advisor before making any adjustments to your portfolio. Good luck to all 🙂

~George

$7.4 Billion In One Day!

The consumer is alive and well which is evidenced by a record $7.4 billion in online sales in one day. Black Friday set a United States record for online sales and between Thanksgiving Day and Black Friday over $11 billion in online sales rang the register. Well it’s not that hard to believe when all that the stock market has done this year is set record after record. As we enter the last month of the year, the Dow Jones Industrial Average (see chart here) is trading above 28000, the S&P 500 (see chart here) starts December near an all-time high, the Nasdaq Composite (see chart below) is also near an all-time high and the small-cap Russell 2000 (see chart here) also has hit its stride breaking out above a triple top that has formed over the past few months.

I have been writing my blog for almost 10 years and I thought years one through five of the recovery from the depths of the 2008 financial crises was impressive. What’s even more impressive to me is that over the past year or so we keep setting record after record despite having one of the most unstable governments in our history. Who would have thought that with a pending impeachment, a trade war with China and tape bomb after tape bomb hitting the tape we would still be at or near record highs? Simply incredible! With that said, the Federal Reserve has done its part this year by reducing interest rates which is probably one of the main reasons the markets still remain at or near record highs.

The technical shape of the stock market appears to still be intact. Despite reaching overbought conditions last week, Friday’s pullback brought the RSI level of the aforementioned indexes back below the 70-value level. The relative strength index is a technical indicator that expresses overbought and/or oversold conditions. The 70-value level of the RSI is considered overbought while the 30-value level is considered oversold. The major indexes all traded above the 70-value level until the most recent pullback. Even if we see a meaningful pullback here in December, there are plenty of support levels that will come into play with the 20-day, 50-day, 100 and 200 day moving averages which are all below where we are trading at today and historically acts as support in sell-offs.

Good luck to all 🙂

~George

$7.4 Billion In One Day! - Paula Mahfouz

Retail Stocks Retreat!

So does this mean the consumer have closed their wallets? The SPDR S&P Retail ETF (Symbol: XRT) which has over 500M in net assets with holdings in a wide variety of the retail space has lost over 10 percent over the past few weeks with 4.4% of this sharp decline  occurring last Wednesday alone. This was the largest one day drop for this widely followed retail stock ETF in almost 5 years. Some individual retailers have even fared worst over the past month or so as their earnings reports and outlooks have been bleak to say the least. Just take a look of the charts of Macy’s (Symbol: M) and Nordstrom Inc. (Symbol: JWN) and you can see just how much these retails missed their earnings numbers and well as how they guided for the upcoming quarter and second half of the year.

No question the retail sector sell-off had an effect on the overall markets with the Dow Jones Industrial Average (chart) closing down over one percent on the week, the Nasdaq (chart) finished lower by one half of one percent, the S&P 500 (chart) closed lower by the same margin and the small-cap Russell 2000 (chart) closed the week out down over one percent.

As mentioned in my previous blog, the technical shape of the aforementioned indices appear to be breaking down and this past week did not help at all. So now it’s not just the 20-day moving averages that have been breached, each of these indexes have all now broken through their respective 50-day moving averages. What’s more, is we do not find ourselves in an oversold condition according to the relative strength index also known as the RSI. So with no real market moving catalysts this upcoming week, it is possible that the current selling pressure continues until oversold conditions occur or other support levels are hit. Good luck to all.

~George