No June Swoon This Year…

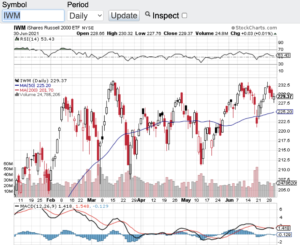
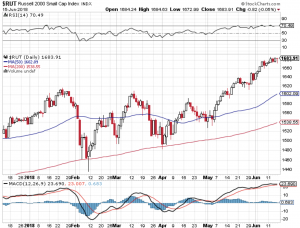
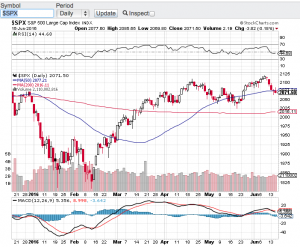
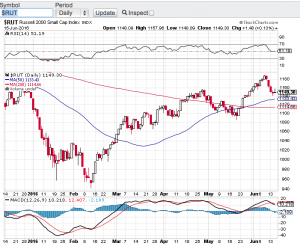
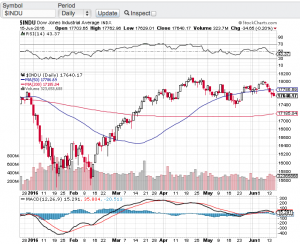
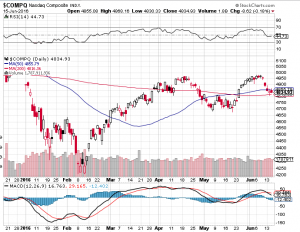
No June swoon this year, these markets are simply not having it. June historically can be either a slow month or a month of selling pressure. Neither really happened this year. Despite a brief dip in the major averages a couple of weeks back due to inflation concerns, stocks and indexes held their own last month. The Dow Jones Industrial Average (see chart here) closed out the month at 34502, the S&P 500 (see chart here) finished the month just shy of 4400, the Nasdaq Composite (see chart here) closed out the month in record territory at 14503 and the small-cap Russell 2000 (see chart below) finished the month and first half of the year at 2310.

I remain in awe of the resiliency of stocks and most every other asset class out there. I read the other day that Facebook (NasdaqGS: FB) has become the fifth company in the United States to surpass the $1 trillion value mark. We now have in our country five companies that are valued at over $1 trillion dollars. Apple (NasdaqGS: AAPL), Amazon (NasdaqGS: AMZN), Microsoft (NasdaqGS: MSFT) and Alphabet aka Google (NasdaqGS: GOOGL) round out the top five trillion-dollar companies. When I see this type of action it makes me wonder how much earnings power do these companies need to continue to exhibit in order to keep their eye-popping valuations going? One other obvious similarity is the companies are all tech stocks and that is where the real growth has been. If you go back 20 years, I don’t think anyone would of expected five companies in our markets all reaching and boasting trillion dollar plus valuations. Heck, Microsoft’s market cap just surpassed $2 trillion dollars to join Apple as the only companies with more than a $2 trillion dollar valuation. Folks I am not a forensic analyst, but my goodness how is the law of large numbers playing a role here?

As I look at the technical shape of the major averages nothing really stands out to me with the exception of the Nasdaq Composite (see chart here). The Nasdaq has just entered overbought territory according to the relative strength index aka the RSI. The Nasdaq also just hit an all-time high so I think some sort of pullback could potentially be in the offing.

Have a safe and happy 4th of July weekend 🙂

~George

No June Swoon This Year - Paula Mahfouz


The Economy Is Booming, But…

There is no question the economy is booming but what does this mean long term for stocks? When the economy is firing on all cylinders like it is now here in the United States one may think the stock market must be ready for its next leg up! Not so fast. Historically when the economy heats up and the unemployment rate becomes so low, that does not typically bode well for stocks. Why you ask? Simply put, the Federal Reserve does not want inflation to rear its head up and their main tool to avert inflationary pressures is to raise interest rates. As counterintuitive as it may seem, a strong economy and low unemployment may be the catalyst to put the brakes on this almost 10 year bull market run. That said, the major averages continue to show extraordinary resilience no matter what comes at it. The Dow Jones Industrial Average (chart) closed the week above 25,000, the S&P 500 (chart) finished the week at 2779, the Nasdaq Composite (chart), finished near its all time high and the small-cap Russell 2000 (see chart below) closed the week out a few points away from it’s all time high as well.

It is quite remarkable how the aforementioned indexes are behaving with all things considered. This past week the Federal Reserve raised interest rates again and signaled two more hikes this year and the trade war chatter and action with China and our own allies for that matter is accelerating. Just these two events alone show be putting selling pressure on stocks not setting new record highs as is the case this past week with the Nasdaq Composite (chart) and the Russell 2000 (chart). These indexes also remain well above key moving averages which at some point in time reversion to the mean should occur. I will be looking for opportunities on the short side but will continue to respect the fact that this years-long bull market remains intact at least from a technical standpoint. Good luck to all 🙂

~George

george mahfouz jr - Russell 2000


Dow 20,000!

There has been plenty of chatter over the past month or so as to whether or not the Dow Jones Industrial Average (chart) would surpass the 20,000 mark and what that would mean for the markets going forward. Well lo and behold, it did it! For the first time in its history, the Dow Jones Industrial Average (chart) breached the 20,000 milestone mark last week thanks in part to earnings reporting season. The Nasdaq (chart) also continues to set record highs although this week this particular index has recently been challenged by Donald Trump’s commitment to altering the H-1B visa rules which in turn could effect the tech industry in a meaningful way. The S&P 500 (chart) also remains near its all-time highs while the small-cap Russell 2000 (chart) is hovering around its 50-day moving average.

While earnings reporting season remains a key focus for investors, one cannot ignore the constant daily flow of news out of Washington D.C. President Donald Trump like no other has signed double digit executive orders in his first week of office alone fulfilling part of his campaign pledges. These executive orders range from loosening regulations in a variety of industries, to border security, to withdrawing the United States from the Trans-Pacific Partnership Negotiations agreement and to the construction of the Keystone XL pipeline, just to name a few. Without question Donald Trump means business and is acting swiftly about it. We know how the American public feels about this and most recently how corporate America is beginning to speak out, and it’s a mixed bag to say the least.

The question now is how will the markets ultimately react to the new norm, the protectionism posture of the new administration and the swift policy changes that are occurring? Well for the first time in a while market volatility (see chart below) has spiked as investors and traders alike try to digest the ultimate outcomes of such dramatic changes. In my humble opinion, vol is just getting started. Good luck to all 🙂

~George

Dow 20,000 George Mahfouz Jr

Looks Like A Double Top…

A recent attempt to breakout to all-time highs has seemingly failed. The Dow Jones Industrial Average (see chart below) , the tech-focused Nasdaq (see chart below), the S&P 500 (see chart below) and the small-cap Russell 2000 (see chart below) all appear to have “double topped” and have retreated to support lines. Without question growth concerns here in the United States are abound. These concerns escalated right after the release of May jobs report which was dismal to say the least. Couple these concerns with the potential of the United Kingdom leaving the European Union and its no wonder why the markets have pulled back over the past couple of weeks.

One of the risks to the markets that I highlighted in my last blog were interest rates. It appeared at the beginning of the month that the Federal Reserve and market pundits were all but certain that a rate hike would occur at today’s Federal Reserve meeting. Well thanks to the underwhelming May jobs report, no rate hike occurred this month and furthermore the Federal Reserve have lowered their outlook for any near term future increases! The Fed did say that they will be monitoring our economy and the data to guide them in their future policy decisions and sure enough they continue to stand by this protocol.

Now what? First for me, I want to see how the market reacts to next Thursday’s vote as to whether or not Britain leaves the European Union? Momentum does appear to be increasing for a British exit, which could lead to a global slowdown? Nobody knows if the referendum will pass or what type of effect this will have across the pond or here in the U.S. In the meantime, I will be monitoring the technical shape of our key indices and as you can see in the below charts each of these indexes have found support at either the 20-day, 50-day or 200-day moving averages.

Good luck to all 🙂

~George Mahfouz, Jr.

george mahfouz jr SPX chart

george mahfouz, jr Russell chart


george mahfouz jr Dow chart

george mahfouz jr nasdaq chart