Is More Volatility Ahead?

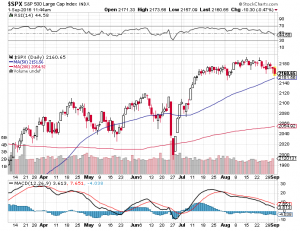
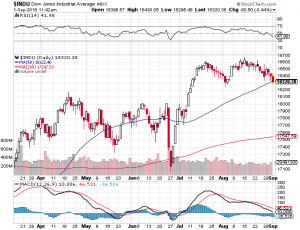
The month of August proved to be one of the more volatile months so far this year. The question now is will this volatility continue here in September? As long as the turbulent tweets continue out of Washington, I bet the vol we witnessed in August will indeed continue this month. Markets hate uncertainty and as long as our President continues to flip flop seemingly daily and then tweet about it, we could very well be in for more vol. It’s not rocket science, when the tweets are positive and have consistency, stocks go green. Then when the flip flopping occurs they go red. It is amazing to me how stocks react to every single tweet or flip out of Washington. Sure there are algorithms that are programmed to react to headlines, but because of the constant noise out of Washington it’s no wonder we have been whipsawing around.

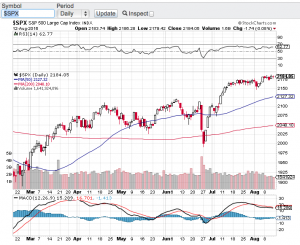
I always try to tune out the noise and focus on the fundamentals and technical shape of the markets. Let’s take a look at the current price to earnings ratio (click here) of the S&P 500. The S&P 500 (see chart here) price to earnings ratio continues to trade above historic norms. Despite all of the current uncertainties especially with the trade war, stocks on average are still trading above the 20 PE ratio level. The historic price to earnings average for the S&P 500 is somewhere in the mid-teens. So from a fundamental valuation standpoint the markets remain at the upper end of the channel. There are many other valuation metrics and government policies that play into the valuation analysis mix, but purely from a price to earnings ratio, one can ascertain that we remain a bit overpriced.

That said, companies can certainly grow into their current valuations but we definitely need to get the trade war with China resolved so that companies know where they stand. Both Paula and I wish everyone a very happy and safe Labor Day weekend 🙂

~George


All Eyes On Jobs Report…

The chatter has increased lately as to when the Federal Reserve will raise interest rates from their historic lows. We may not need to wait much longer to get that answer. Although it is a holiday weekend, the August jobs report will be released tomorrow and the pundits are suggesting that if the economy added more than 200,000 jobs in August, the Federal Reserve will raise rates this month. From my view a quarter point rate hike here in September is no big deal. I think the markets will have a muted reaction. However, if this is the beginning of a consistent pattern then this becomes an entirely different discussion. I do not expect that the Fed will be too aggressive with future rate hikes and of course the economic data will play a role in those decisions.

So what about the markets? We are coming into a seasonality that is typically a weaker time for stocks. What’s more, the markets will also begin to focus on the presidential election and the polls associated with it. That said, I expect an increase in volatility as we head into the fall. There are other catalysts that could weigh in on stocks such as potential changes in global monetary policies and Q3 earnings reporting season in October. The key indices continue to demonstrate strength with the S&P 500 (see chart below) being supported by its 50-day moving average click here, the Dow Jones Industrial Average (see chart below) is within a couple percentage points of its all-time highs, and both the Nasdaq (chart, click here) and the small-cap Russell 2000 (chart, click here) are trading right around their 20-day moving averages. So as of yet, stocks do not appear to be too concerned with the upcoming market seasonality and other potential catalysts that could play a role in interrupting the uptrend we have been in.

Both Paula and I wish everyone a very safe and happy Labor Day weekend 🙂

~George

S&P chart george mahfouz jr

dow jones chart george mahfouz jr

What August Swoon?

Actually quite the contrary! In fact new all time highs occurred this past week with the S&P 500 (see chart below), the Dow Jones Industrial Average (see chart below) and the Nasdaq (chart, click here). What’s more is these record closing highs of the aforementioned indexes occurred on the same day last week, a feat that has not happened since the bubble of 2000. Now I am not suggesting we are in a bubble like we were in dot-com days. Back then valuations of dot-com stocks and most of technology were rather insane. That said, the current price to earnings ratio of the S&P 500 is in the 20’s which is historically high. That alone could be a catalyst for a pause and consolidation and/or a pullback from the record high territory we have been trading in.

I am almost frightened to think or suggest that a retracement of any type is forthcoming simply due to the way the markets have been trading in a typically weak market season. As mentioned in my previous blog, August tends to be one of the weakest months of the year for the stock market. There is still a couple of weeks left in August and it is not too late to see historic trends surface. However, the way stocks have traded lately and with no real economic or geopolitical catalysts in the foreseeable future, this market melt-up may indeed continue.

Technically speaking, the trend lines of the 20-day, 50-day and 200-day moving averages all remain in tact and are yielding upward and the relative strength index of the key averages are not officially in overbought territory. So this is enough for me to not really expect much out of the market in either direction as we head into Labor Day weekend and as the summer winds down. Good luck to all 🙂

~George

S&P chart george mahfouz jr

dow jones chart george mahfouz jr

Not Even The Dog Days Of Summer Can Slow Down This Bull!

Stocks once again defied logic setting records in the month of August, which is typically a soft month for equities. For the month, the Dow Jones Industrial Average (chart) finished up 3.2%, the tech-heavy Nasdaq (chart) closed the month up 4.8%, the S&P 500 (chart) gained 3.8% and the small-cap Russell 2000 (chart) closed the month up 4.85%. Now granted these gains came on relatively low volume, but nonetheless a very impressive performance considering the macro environment we are in especially with the geopolitical concerns in the middle-east and Ukraine. I suppose the U.S. economic numbers that have come out recently is part of the reason why stocks continue to march north. Last Thursday the Commerce Department revised the second quarter U.S. gross domestic product (G.D.P.) number to 4.2% which is quite a healthy expansion of our economy and what’s more, the sources of growth were broad based.

Looking ahead to this month, when traders and investors come back from their summer vacations, they will see all time highs for the S&P 500 (chart), the Dow Jones Industrial Average (chart) and don’t look now, even the Nasdaq (chart) is slowly approaching the 5000 mark, a mark that has not been seen since the tech-bubble of 2000. If you have been bearish or short this market, I do not know what to say other than I feel your pain. We have not had a 10% correction in equities in years now and just the slightest of pullbacks have been met with incessant support. I do not know what is going to break this trend and you know what they say, “the trend is your friend”. Enough of that, seriously, I too have been expecting at least a 5-10% correction, which if you are bullish, you should welcome it. Not only would this be healthy for the markets, in my view it’s getting to the point to where it’s almost required. I am beginning to become a little concerned that should a “black-swan” event occur, and history says “they happen when you least expect it” we could see such a sharp correction, that could trigger margin selling, which would lead to more selling pressure etc., we have all seen this movie before. I am not saying that this will take place, but if it does, and we if don’t have healthy corrections along the way, which we haven’t, this could magnify matters and we would be having a much different discussion.

With all that said, I will continue to monitor the economic numbers this month as well as the technical make-up of the aforementioned indices. Technically speaking, we are now approaching overbought territory according to the relative strength index (RSI). Paula and I wish everyone a very safe and Happy Labor Day 🙂

~George