New Variant Spooks Markets…

A new Covid variant has spooked the markets enough to spike the VIX almost 50% (see chart here). The VIX aka the fear index took off on Friday after news out of South Africa that a new variant has emerged. The CBOE volatility index is a measure of price action in the S&P 500 options chain over the next 30 days. Investors and institutional investors alike pay attention to how investor sentiment is going at any point in time through the CBOE vol index. Historically when the markets are at work with no real headwinds or threats, the VIX in the 10-15 value range. Yesterday the VIX closed north of 27. No question over the past few days the VIX is revealing a bit of investor anxiety.

So now the question becomes is this a short-lived dynamic or is there more selling pressure in the offing? My feelings are this is a normal knee jerk reaction to yet another potential obstacle our economy and markets face. From what I have read we are weeks away to understanding the severity of this new variant or lack thereof. In the meantime, I think patience is key and to not act in haste. For all we know the vaccines could protect the population from this latest variant and if so, the markets could snap right back. However, if this becomes as severe and contagious as the Delta variant, then there is a strong chance the markets would continue to adjust accordingly.

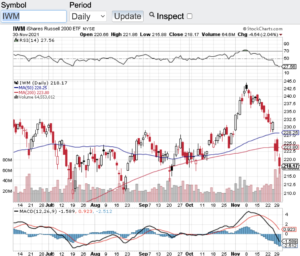
Let’s look at the technical backdrop of the major averages starting with the Dow Jones Industrial Average (see chart here). The Dow sold off over 650 points yesterday to close just above its 200-day moving average. The S&P 500 (see chart here) closed lower by 88 points approaching its 100-day moving average. The Nasdaq Composite (see chart here) closed the month of November down 245 points while breaching its 20-day moving average. Last but not least, the small-cap Russell 2000 (see chart below) closed down sharply as well yesterday, however, technically the Russell broke its 100 and 200-day moving averages in a meaningful way which does not bode well for this particular index as we enter the last month of the year.

One final note, no matter what happens in the market here in the short term, please take care of yourselves and your loved ones. We are approaching the two-year mark of this pandemic and everyone should take this serious, put the politics and conspiracy theories away and come together once and for all.

Wishing everyone a safe and healthy holiday season 🙂

~George
New Variant Spooks Markets - Paula Mahfouz

Stocks Are Back!

Since losing over 10 percent of their values and going into correction territory earlier this year, the major averages now find themselves almost back to par. Year-to-date the Dow Jones Industrial Average (chart)  is only down around one percent, the S&P 500 (chart) is also lower by around one percent, the Nasdaq (chart) on the year has gained back over half of its losses and the small-cap Russell 2000 (chart) is lower by 4.5%. Since this bull market began over seven years ago, time and time again stocks have demonstrated astounding resilience. Seemingly every time there is a sell-off, willing buyers are ready to step in at varying support levels and buy up equities.

Today the Federal Reserve left interest rates unchanged and actually slashed their forecast to project only two additional rate hikes for the rest of this year versus the four rate hikes they had originally targeted. Stocks initially popped on the news and only one can conclude that the continuing accommodating monetary policies not only here in the United States, but from around the world is most likely the reason why this seven year bull market continues.

That said, the aforementioned indices are approaching overbought conditions according to the relative strength index. Remember the RSI is one of the favorite technical indicators by market technicians, certain algorithmic programs and institutional investors alike. The relative strength index measures and compares the size of moves in a selected period of time and according to the RSI, the 70 or greater value level signals an overbought condition and the 30 value level or lower indicates an oversold condition. Keep in mind stocks and/or indexes can remain overbought or for that matter oversold for an extended period of time. Currently the Dow Jones Industrial Average (chart) is almost touching the 70 value level and the other indexes are not too far behind. Of course this is only one of many technical indicators that traders and investors utilize, but I have found over the years the RSI is one of the more reliable indicators out there.

Good luck to all 🙂

~George

Global Concerns Give Markets A Pause…

Stocks had a very volatile week as tensions elevated in Ukraine and now China has seemingly hit a soft patch in its economy. For the week, the Dow Jones Industrial Average (chart) fell 2..35%, the Nasdaq (chart) gave back 2.09%, the S&P 500 (chart) -1.96% and the small-cap Russell 2000 (chart) ended the week lower by 1.82%. I do not think the most recent retreat in stocks is anything beyond the current global headline risks as our own economy appears to be intact and growing, albeit modestly. Some economists believe China will maintain a 7.5% growth rate this year while other pundits believe a cooling off of China’s economy would affect our markets here. Should the latter be the case, I would assume the Chinese government would take measures to help prop up their economy by injecting enough stimulus to ensure the targeted 7.5% growth rate for 2014 would not be breached. Recently, the economic numbers across the board coming out of China has been weaker than expected, especially in the manufacturing and export sectors.

This past week also saw an escalation in the crisis in Ukraine with both sides increasing the chatter about a potential military conflict as protests have become extremely violent. Governments from around the world are now are attempting to assist in the negotiations with Russia and Ukraine to formalize some type of accord. So it’s no surprise that a “risk off” mentality has come into the markets for the time being. I do believe that once things settle down in the Ukraine and the China headlines become less frequent, we could consolidate here for a bit as the first quarter of the year winds down. Then of course as we enter into April, all eyes will be watching how corporate America fared during the first quarter as Q1 earnings reporting season will begin. Between now and the end of March, I will be paying closer attention to our own economic data which will most likely translate into companies Q1 earnings reports.

Technically speaking, the Dow Jones Industrial Average (chart), the Nasdaq (chart), the S&P 500 (chart) and the Russell 2000 (chart) all appear to be heading towards their respective 50-day moving averages, in fact the Dow (chart)  actually breached its 50-day on Friday. The 50-day moving average is a technical indicator I favor as do other certain market technicians. Historically, when stocks or indexes reach their 50-day or 200-day moving average for that matter, support is typically found and a reversal of the stock or index ensues. The moving averages are also followed by certain institutional investors and select computerized algorithmic trading models, which could also be a reason why the moving averages can act as a support mechanism. Now I am not suggesting that the moving averages are infallible, I personally utilize this indicator mainly from a technical standpoint to help me navigate current market opportunities. Good luck to all.

Have a great weekend 🙂

~George


Record breaking July!

The month of July served up all time highs as Q2 earnings reporting season begins to wind down. For the month, the Dow Jones Industrial Average (chart) closed up 3.50%, the tech-heavy Nasdaq (chart) gained a whopping 6.8%, the S&P 500 (chart) +4.38% and the small-cap Russell 2000 (chart) closed the month up 5.6%. The rally in stocks continue thanks to favorable corporate earnings for the most part, and the Federal Reserve keeping its commitment to do whatever it takes until the economy can stand on its own two feet. Yesterday, after the Federal Reserve’s 2-day policy meeting ended, the central bank reiterated that it would continue its $85 billion per month bond buying program and keep interest rates near zero to help support and strengthen the economy.

That said, August begins with quite the test as all eyes will be on tomorrow’s  jobs report. The July unemployment report should be the most scrutinized report of the year as the Federal Reserve has been on the record recently signaling as to when they may start pulling back on its monthly bond purchases. A stronger than expected report may compel the Fed to begin tapering as early as September. However, if job growth continues to be modest, then I think its safe to say the accommodative policies of the Fed will continue into the foreseeable future. So you may ask what does this all mean to the market? This may become the case where good news in the labor market may be bad news for stocks. I know it seems counterintuitive, however, just the notion in late May that the Fed was considering tapering sooner than later sent the markets down five percent in a matter of a couple of weeks. I think everyone from the hedge fund community to mutual funds to institutional investors and even the individual retail investor have been so reliant on this accommodative Fed, that once the tapering actually begins, we may just see the stock market correction the bears have been anticipating all year long.

Technically speaking, although the markets are seemingly overbought, the key indices are not at extreme overbought conditions, just yet. Let’s take a look at the relative strength index (RSI) on the Dow Jones Industrial Average (chart), the Nasdaq (chart), the S&P 500 (chart) and the Russell 2000 (chart). As you can see, these indexes are trading below the 70 value level which is the level most market technicians consider an extreme level. I personally consider the 75-80 value level as extreme, especially in today’s market environment. That said, it appears there has been some consolidation going on over the past couple of weeks with the aforementioned indexes which have been trading in a pretty tight range.  Just maybe tomorrow’s unemployment report will be the catalyst for stocks to breakout of its recent trading range and begin a new trend. I view a breakdown of the 1650 zone in the S&P 500 (chart) as bearish. However, should the S&P 500 (chart) break and close above 1700 in a meaningful way, we may just see the extreme overbought conditions come into the marketplace as mentioned above. Good luck to all and I wish you all a very profitable month.

All the best 🙂

~George

Technically speaking…

Stocks finished lower for the week as volatility continued to rise. For the week, the  Dow Jones Industrial Average (chart) closed down 1.17%, the Nasdaq (chart) -1.32%, the S&P 500 (chart) -1.01% and the small-cap Russell 2000 (chart) closed the week lower by 0.63%. Is this bull market beginning to show signs of fatigue or is this just a typical pre-summer pullback? Let’s take a look at the technical picture of these key indices and see what’s going on there.

Market technicians use a multitude of indicators to discern potential support or resistance levels. My preference has always been to keep things as simple as possible when analyzing charts of stocks or indices. The two indicators I pay the closet attention to is the Relative Strength Index also know as the RSI and the moving averages. Out of dozens of technical indicators that are available, you may ask why do I prefer these particular indicators? The answer simply is that high profile market technicians,  computerized trading models and certain institutional investors utilize them.  Time and time again when I see that Relative Strength Index (RSI) is indicating an overbought or oversold condition, the majority of the time the asset or index reverts to the mean. Same rings true with the moving averages, whenever a stock or index bumps up against or comes down to its moving average, typically the stock or index finds support or resistance.

Let’s break this down in more detail. Pertaining to the (RSI), The RSI is designed to demonstrate whether or not an index or equity is overbought or oversold, depending on certain value levels. According to the RSI principle, the 70 value level or greater, is an overbought condition and the 30 value and below is an oversold condition. As of right now the aforementioned indices are hovering around the 50 value level which is not indicating an extreme condition either way. Looking at the moving averages these indices remain above their 50-day moving average and as you can see with the Dow Jones Industrial Average (chart) and S&P 500 (chart), these indexes have bounced off their 50-day moving averages/support lines three times over the past week or so which clearly demonstrates the potential of the power and precision of this particular technical indicator.

So technically speaking, I see nothing that would indicate an extreme condition of these indexes and as long as their are no major surprises out of the FOMC meeting next week, we should see smooth sailing heading into the summer. Good luck to all.

Have a great weekend 🙂

~George

Tough week for stocks…

Earnings reporting season is in high gear and the markets are not liking what they are seeing. For the week, the Dow Jones Industrial Average (chart) fell 1.77%, the Nasdaq (chart) -0.59%, the S&P 500 (chart) -1.99% and the small-cap Russell 2000 index (chart) declined 2.89%.

For the most part, corporate America continues to show a slowdown in their businesses and companies are also providing tepid outlooks in the near term citing the uncertainty of the pending fiscal cliff, and the expiration of the Bush era tax cuts. Even tech-titan Apple (NasdaqGS: AAPL) guided with an outlook that caught the street off guard. Despite the disappointing earnings reporting season so far, the key indices have managed to remain above their respective 200-day moving averages. The 200-day is one of the most closely watched key technical support indicator that market technicians and institutional investors respect.

Next week, Q3 results will continue to pour in so I expect that the 200-day will once again be tested. If this is the case, and this key technical level can hold, we just may make a run into the end of the year? Good luck to all.

Have a great weekend 🙂

~George