Who’s Ready For The New Year?

After one of the weakest market performances since 2008, who is ready for the new year? I know I am!

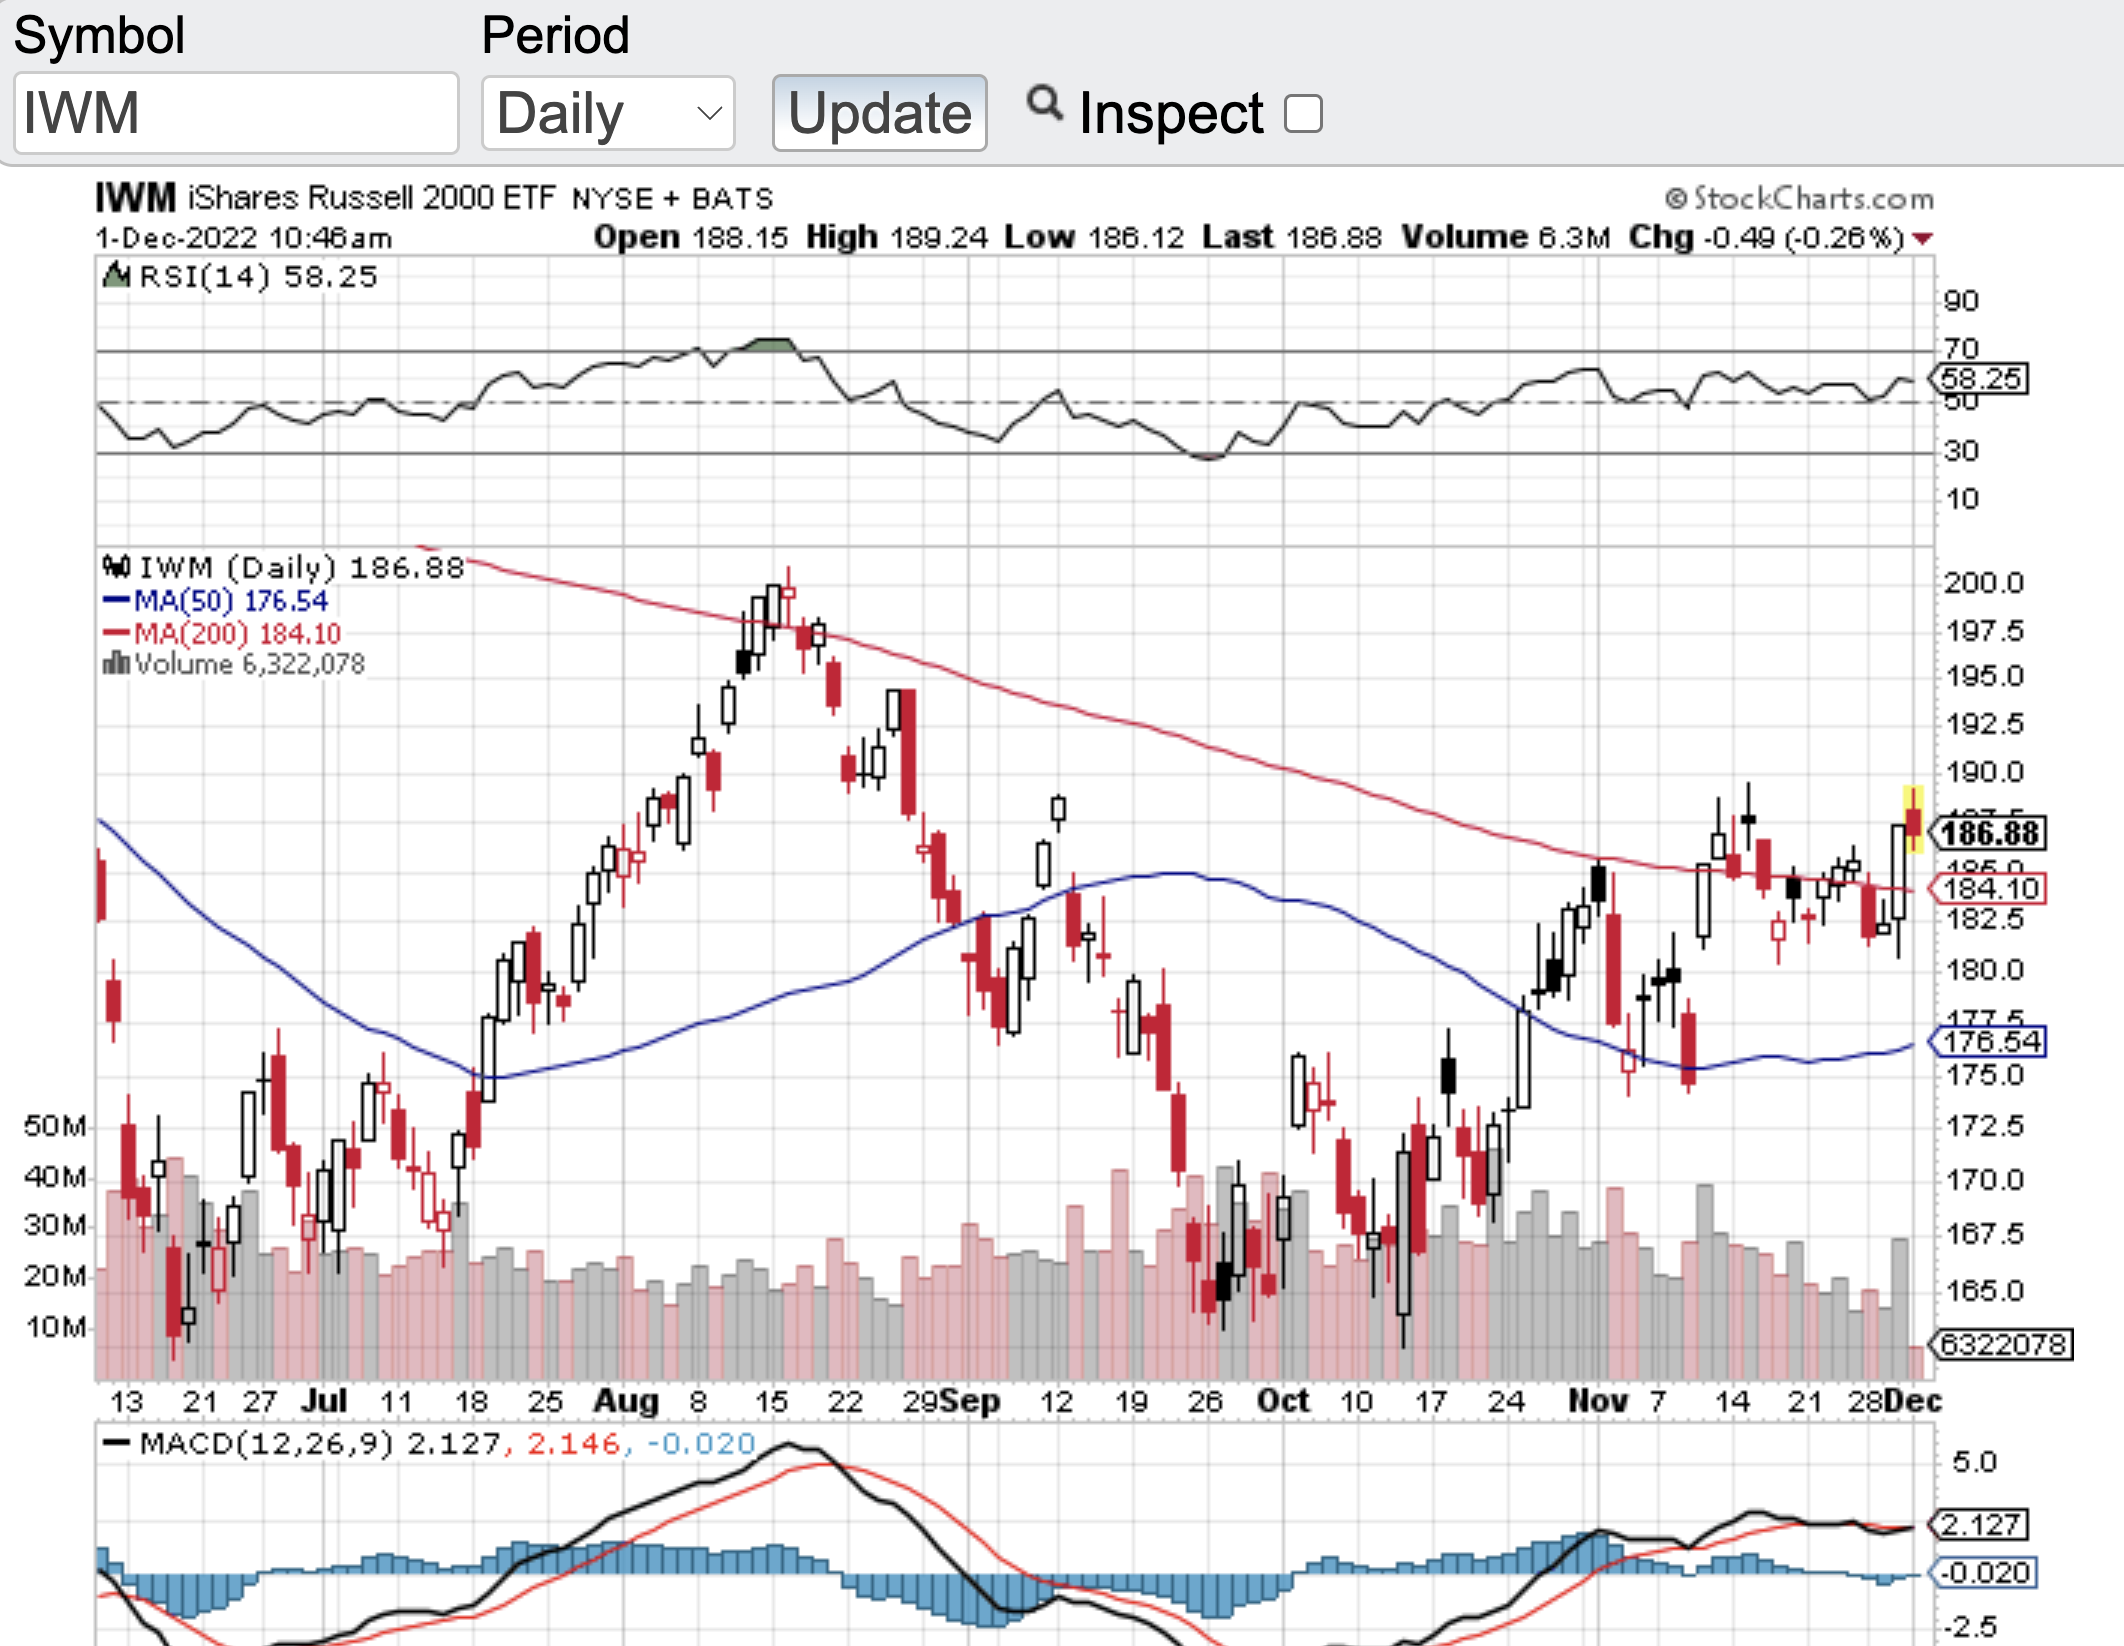
Let’s take a look at how the major averages closed the year out. The Dow Jones Industrial Average (see chart here) finished lower by 8.78%, the S&P 500 (see chart here) shed almost 20%, the Nasdaq Composite (see chart here) fell a whopping 33% and the Russell 2000 (see chart here) closed the year down over 21%. Despite the bear market we now find ourselves in let’s not forget of how we got here. For the past 10 plus years and especially the past 3 years, central banks from around the world flooded the system with enormous liquidity. This liquidity came in many forms and with essentially charging little to no interest. The Federal Reserve Banks from around the globe started these programs when the 2008 financial crisis hit and for the better part of 15 years had not let up. What changed their position is how inflation took off this year to rates not seen in over 40 years.

Fast forward to today and we now have watched the Federal Reserve raise interest rates multiple times over the past several months and along with that taking the stock market with it. That said, I don’t blame the Fed for raising rates, in fact some pundits might argue as to why it took so long. Oh yea, a once in a century global pandemic shocked the world and the economy. So, what should have been a policy shift years ago became extended stimulus parade of liquidity into the system. Which by the way was very needed. Ok, so let’s not panic as to what occurred in the markets last year, from my vantage point this appears to be simply a function of interest rates and markets beginning to normalize.

Wishing everyone the healthiest, happiest, and most prosperous New Year 🙂

Cheers,

~George


Trying To Make Up Its Mind!

Seemingly, the markets are trying to make up their mind on whether to breakout or breakdown. Over the past couple weeks, the Dow Jones Industrial Average (see chart here), the S&P 500 (see chart here), the Nasdaq Composite (see chart here) and the small-cap Russell 2000 (see chart here and below) have all been consolidating in a very tight trading range. As you can see in the charts of these major averages, consolidation has occurred while also finding support at their 100 and 200-day moving averages. These tight trading ranges along with moving average support bodes well for an inevitable break from this current trading range . The question is will the markets breakout before year end or breakdown and through their respective moving averages support lines?

Let’s face it, we are currently in a bear market and rightfully so. It has been repulsive to see how inflated asset prices were during the heart of the pandemic. Stimulus was abound, interest rates remained at all-time lows and then speculation went from reasonable to very disturbing. This recipe set up the bear market and then Federal Reserve launched it by aggressively raising interest rates. My comment to that is what took them so long? The Fed had no choice to but to start raising rates and inflation took off to levels not seen in over 40 years. The silver lining to all the above is that finally we are moving towards a market that is now more trustworthy. Trustworthy from the standpoint that stocks may actually start trading at reasonable levels to where opportunities can be found. In fact, it is possible that certain stocks and sectors for that matter will overshoot to the downside to where great opportunities could come to the forefront.

As mentioned above, stocks are currently trading in a tight trading range and have support at their moving averages. However, with year-end approaching and as traders and investors reposition their portfolios I would not be surprised if we exit this tight trading range the markets have been in.

Good luck to all 🙂

~George

What Bear Market?

The major averages in December entered into bear market territory and seemingly was heading even lower. But lo and behold and fast forward to today and we see that the key indices have all come roaring back.  The definition of a “bear market” is when a stock or an index goes down 20% or more from its highs and that was definitely the case in the second half of 2018. The Dow Jones Industrial (see chart here) is now back over 24,000 after dropping below 22,000 in December, the S&P 500 (see chart here) is back over 2,600 after dropping below 2,400, the Nasdaq Composite (see chart here) is now over 7,100 after hitting a low of 6,190 and the small-cap Russell 2000 (see chart here) it trading above 1,400 after hitting a low in December of 1,267.

The sharp V shaped bounce back in such a short period of time is very impressive. I do not think anyone expected such a sharp rebound in just a month. This surprise move is also happening despite the ever increasing chaos and turmoil out of Washington DC. Is it me or has it gotten to the point of utter disgust with what is happening to our country. I am not much of a political advocate in either direction but the narcissism and antics coming out of DC is unbelievable. What’s more is that they are using the government shutdown as the pawn to get their way, again unbelievable.

Ok enough of that and back to the markets. We are now heading straight into earnings reporting season and to me this without a doubt will be a significant catalyst as to whether or not stocks will continue to rise or pause. Of course any type of meaningful progress with the trade war and China could also play a major role. The Federal Reserve has been more vocal with interest rates and indicating that they are more apt to more of a wait and see approach as to any additional rate hikes in near term. There is a lot at hand here which should determine whether or not this bounce back rally will continue. Good luck to all 🙂

~George

Undeniable Market Correction!

Despite this morning’s relief rally, stocks and indexes are either in an undeniable market correction or in an actual bear market. Healthy corrections are 10% or so declines, bear markets are defined by a 20% or more of a decline. This is where the small-cap Russell 2000 (click here for chart) finds itself and that is in a bear market. The Dow Jones Industrial Average (chart) is not quite in bear market mode nor is the Nasdaq Composite (chart) or the S&P 500 (chart). However, these indexes have lost over 6% of their value in December alone. Not since the great depression has the markets been hit this hard in the month of December. Furthermore, market sentiment has not hit this low since the 2008 crisis either.

So what is going on? The default answer to this question is the Federal Reserve and rising interest rates. The Fed actually meets tomorrow to decide on whether or not to raise by a quarter point. I think what’s even more important than whether or not they hike rates, it’s how dovish or hawkish they are in their testimony. I have to believe with how sharp and how fast stocks have corrected they may lean towards the more dovish spirit with a wait and see approach before raising rates again. The other default answer as to why stocks have been beaten down is the confusing messages that constantly flow out of Washington, especially as it pertains to the China trade war. The markets hate to be confused by policy makers especially our President and instead of holding on, clearly investors and traders alike have been dumping stocks for weeks now. If the Fed communicates their intentions clearly and if Washington is capable of doing the same, this could be just a market correction. If not, then I think we could see all of the aforementioned indexes fall into bear market territory. Good luck to all:-)

~George