Happy New Year!

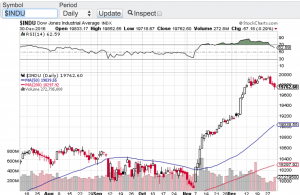
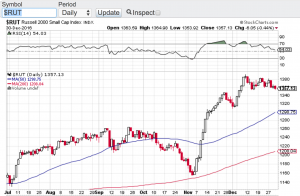
Happy New Year to all and what a year of celebration for the bulls in 2016. The major averages last year notched very impressive gains. The Dow Jones Industrial Average (see chart below) finished the year up 2,337 points or 13.42%, the tech focused Nasdaq (click here for chart) closed up on the year 376 points or 7.5%, the S&P 500 (click here for chart) closed up 194 points or 9.54% and the small-cap Russell 2000 (see chart below) finished out 2016 up a whopping 221 points or almost a 20% gain outperforming most benchmarks. This eye-popping rally really kicked into high gear after the stunning upset victory Donald Trump pulled off over Hillary Clinton in the presidential election. So that was last year, now let’s take a look at 2017 and what lies ahead.

I begin with the obvious. Markets are certainly overbought and have been since the November 8th election results. Then in December, the Federal Reserve raised interest rates for the first time in a year and then added language for an additional rate hike in 2017 to bring the total projected rate hikes this year to at least three. Historically a rising interest rate environment puts pressure on equities and in particular the high beta names. Consensus has it that the Fed will move slowly to avoid any shocks to the economy or the markets. However, with Donald Trump’s proposed economic pro-growth policies, debt and inflation should rise. So I am sure the Federal Reserve will be keeping a close eye on how inflation ticks up as 2017 unfolds. Should inflation rise faster than anticipated this too could be a challenge for the Fed and our stock market.

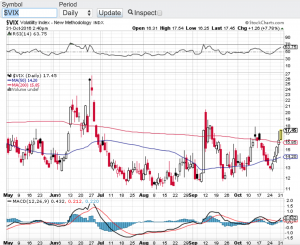
So based on our current market environment it is my view that volatility will not only pick up in January but the recipe described above signals potential elevated volatility throughout the year. We also will begin to hear from corporate America this month as we head into earnings reporting season. I would expect earnings from multi-national companies to be a bit challenged due to the continuing and significant strength that the U.S. dollar has been exhibiting. That said, there will be opportunities abound in this new year but I am preparing to embrace volatility and hedge my positions going forward. In my next blog I will talk about hedging strategies in order to offset the impact of potential increased vol. Until then, both Paula and I wish everyone the happiest and healthiest new year to all. 🙂

~George

Dow Jones chart Paula MahfouzRussell 2000 post george mahfouz jr


Quietly The VIX Elevates…

Over the past week the CBOE Market Volatility Index aka the VIX (see chart below) has risen over 35%. Not too surprising considering the upcoming elections and the daily rhetoric that has been hitting the wires. What is surprising to me is that even though volatility has spiked recently, the markets have not really dropped. Isn’t how this is supposed to work? Increase in vol equals lower stock prices? The Dow Jones Industrial Average (chart), the S&P 500 (chart) and the Nasdaq (chart) all remain within striking distance of all-time highs and so far these key indices do not seem to be too bothered by the daily political headlines. Even Friday’s surprising if not shocking news that F.B.I. director James Comey has re-opened the Hillary Clinton email case could not rattle the markets. Although this particular headline did send stocks sharply lower in the late afternoon trading on Friday only to find support and close off of the lows.

I will say this; I am even more surprised that yesterday we did not see a sell-off in stocks after everyone had time to digest the news over the weekend. Stock market pundits continue to claim that the markets have priced in a Clinton victory and that her taking the White House in general will be bullish for stocks. I tend to agree with this however; my concern is will this be a “sell the news” event? I will also be paying closer attention to the polls this week to see if the Trump campaign closes in on the Clinton lead. This too can be a market moving dynamic. So as the VIX continues to lift and as we get closer to November 8th, I will error on the side of caution and lighten up any long positions and wait to see how this election plays out. Let’s also see how the markets react and respond to the election results and then come up with a game plan into year-end. Good luck to all 🙂

~George

VIX chart George Mahfouz Jr

A Spooky Time For Stocks?

As Halloween fast approaches is this also a spooky time for stocks? Without question volatility has picked back up which to me is no surprise at all. Factor in all of the headlines out of Europe, earnings reporting season here at home and last but not least, the daily Hillary Clinton and Donald Trump show. It’s no wonder stocks are bouncing around all over the place. For the week, the Dow Jones Industrial Average (chart) closed lower by one half of one percent, the Nasdaq (chart) closed off by 1.5%, the S&P 500 (chart) -1.0% and the small-cap Russell 2000 (chart) lead the pack and finished the week lower by 2%. With all of the headlines and headwinds for that matter, I still remain quite impressed by the resiliency of stocks despite facing a multitude of uncertainties.

This upcoming week should also be a doozy as earnings reporting season kicks into high gear. Starting off the week, Bank of America (NYSE: BAC) will release their quarterly results followed by International Business Machine (NYSE: IBM), Goldman Sachs (NYSE: GS), Intel Corp (NasdaqGS: INTC), Johnson & Johnson (NYSE: JNJ), American Express (NYSE: AXP), Ebay (NasdaqGS: EBAY), Morgan Stanley (NYSE: MS), American Airlines (NasdaqGS: AAL), Microsoft Corp (NasdaqGS: MSFT), Paypal Holdings (NasdaqGS: PYPL), Verizon Communications (NYSE: VZ), General Electric (NYSE: GE), Honeywell (NYSE: HON) and McDonald’s Corp just to name a few. Expectations for this earnings reporting season is subdued and any upside surprise could bode well for sentiment during these volatile times.

Let’s take a quick look at the technical shape of the aforementioned indices and all but the small-cap Russell 2000 appear to be finding support either at their 50-day or 20-day moving averages.  The small-cap Russell 2000 (chart) does appear to be breaking down at an accelerated rate however, it does appear that the 1200 level of the Russell 2000 should be met with a bit of support.

Both Paula and I wish everyone a very safe and Happy Halloween and good luck to all. 🙂

~George