Stimulus Package Chatter Buoys Markets…

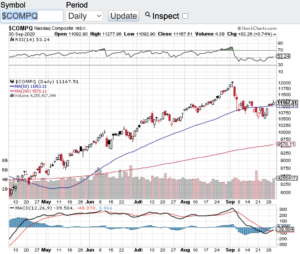
Yesterday, the lastest round of stimulus package chatter came out of Washington which helped buoy our markets. The Dow Jones Industrial Average (see chart here) closed the month of September out at 27781, the S&P 500 (see chart here) finished the month at 3363, the Nasdaq Composite (see chart below) closed at 11167 and the small-cap Russell 2000 (see chart here) finished at 1507. Although stocks had a strong close to end September, the month of September was a net negative for the markets. No question the uptick in COVID both here and abroad has put some pause to this bull market rally. Quite honestly, I think stocks have held up pretty well despite the ongoing pandemic and the constant tape bombs coming out of Washington.

Fast forward to today and we are now a month away from our Presidential election. I have got to believe that we are heading into more volatility than what we experienced in September. I think whoever watched the first Presidential debate would agree. In addition to the upcoming election, we are also heading right into Q3 earnings reporting season. Corporate America will be releasing their third quarter financial results over the next 45 days or so and that alone can create higher volatility. I am not sure what to expect when companies report their numbers and even more so how companies provide their forward looking guidance on their conference calls. Whatever the case is, I think it’s fair to say we will not be trading sideways here in the month of October.

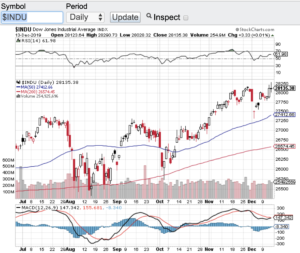
Let’s take a gander at the technical shape of the aforementioned indexes. What has impressed me lately is how the Dow Jones Industrial Average (see chart here) found support near its 200-day moving average and more recently its 50-day moving average. The same can be said for the other major averages in how they too have found support at their respective moving averages. What’s more is these key indices are no where near overbought territory according to the relative strength index aka the RSI. So from a technical analysis standpoint, the markets look to be on solid footing.

Good luck to all 🙂

~George
Stimulus Package Chatter Buoy Markets - Paula Mahfouz

Happy New Year And New Decade!

Happy New Year and New Decade! However, I am not so sure investors want to say goodbye to 2019. What a year for stocks and the major averages. In 2019 the Dow Jones Industrial Average (see chart here) gained 22%, the S&P 500 (see chart here) soared almost 30% on the year, the Nasdaq Composite (see chart here) was the best performing major average up 35% and the small-cap Russell 2000 (see chart here) closed 2019 up almost 24%. This is the best annual performance for these key indexes in years. As far as the decade goes, the major averages also soared gaining almost 300%. Not a typo folks the markets almost tripled in value over the past decade.

So as we enter the new year the question now becomes what now? Well it is hard to imagine that we will see a similar result in 2020. Not that I am bearish at all but I do expect some higher than normal volatility throughout 2020. Geopolitic tensions have started to ramp up a bit and in Washington the focus and attention will be on the Senate impeachment trial. As much as the Republicans control the Senate, there is no guarantee that bombshells won’t come out of the trial. This especially rings true if the House Democrats gets witnesses to the stand. We cannot predict what may come out of this trial and I got to believe at times it won’t be pretty. Also, the month of January can be volatile just from the standpoint of how much the markets gained in 2019. I am pretty confident that we will see some institutional and other managed funds book gains here in January.

One other consideration is how the markets as a whole became overbought as 2019 came to an end. All of the aforementioned indexes went into overbought conditions in December according to the relative strength index (RSI). Although there was a brief retreat from the overbought 80 value levels of the RSI, we still remain near the upper end of the charts and I would not be surprised to see some selling pressure here in the month of January.

Good luck to all 🙂

~George

It’s A Broken Record!

It’s a broken record indeed! That is the continuing record breaking run on Wall Street. On Friday the Dow Jones Industrial Average (see chart here), the S&P 500 (see chart here), the Nasdaq Composite (see chart here) set new all time highs. Seemingly, there is no stopping this record setting run that the markets have been on, at least for now. The latest catalyst was news out of Washington that the U.S. and China are close to coming to a “Phase 1” agreement on a trade deal. As I eluded to in my November 15th blog, new record highs could come into play by year-end if we see a trade deal happen. The caveat here is the deal is being titled as a “Phase 1” agreement and there is much more to agree upon to finish the deal out. That said, this is a definite step in the right direction and the markets seem to agree. I do want to keep my enthusiasm in check because of the volatility that continues to come out of Washington on this subject. We have all seen over the past several months tweets and statements out of Washington that we are close to a deal with China to only then wake up the next day to get the opposite statement either out of Washington or China. Phase 1 is a great step, but I am looking forward to the complete deal getting done and most likely that will yield to the first quarter of 2020.

In the meantime, investors are continuing to enjoy record highs and there doesn’t seem too much ahead between now and year-end that will change the course. The technical shape of the bellwether indexes remain intact. The Dow Jones Industrial Average (see chart below), the S&P 500 (chart) and the Nasdaq Composite (chart) are all trading below the 70 value level of the relative strength index (RSI). Also, each of these indexes are trading healthily above their 20, 50, 100 and 200 day moving averages.  

Paula and I wish everyone a very safe and happy holiday season.

~George

It's A Broken Record! - Paula Mahfouz


Is More Volatility Ahead?

The month of August proved to be one of the more volatile months so far this year. The question now is will this volatility continue here in September? As long as the turbulent tweets continue out of Washington, I bet the vol we witnessed in August will indeed continue this month. Markets hate uncertainty and as long as our President continues to flip flop seemingly daily and then tweet about it, we could very well be in for more vol. It’s not rocket science, when the tweets are positive and have consistency, stocks go green. Then when the flip flopping occurs they go red. It is amazing to me how stocks react to every single tweet or flip out of Washington. Sure there are algorithms that are programmed to react to headlines, but because of the constant noise out of Washington it’s no wonder we have been whipsawing around.

I always try to tune out the noise and focus on the fundamentals and technical shape of the markets. Let’s take a look at the current price to earnings ratio (click here) of the S&P 500. The S&P 500 (see chart here) price to earnings ratio continues to trade above historic norms. Despite all of the current uncertainties especially with the trade war, stocks on average are still trading above the 20 PE ratio level. The historic price to earnings average for the S&P 500 is somewhere in the mid-teens. So from a fundamental valuation standpoint the markets remain at the upper end of the channel. There are many other valuation metrics and government policies that play into the valuation analysis mix, but purely from a price to earnings ratio, one can ascertain that we remain a bit overpriced.

That said, companies can certainly grow into their current valuations but we definitely need to get the trade war with China resolved so that companies know where they stand. Both Paula and I wish everyone a very happy and safe Labor Day weekend 🙂

~George


The 200-Day Moving Average Holds!

The 200-day moving average held its ground despite the constant tape bombs and tweets that continues to come out of Washington. It is no secret that stocks have been on a wild ride over the past few weeks from making all-time highs to rip roaring selloffs. The continuation of tariff threats out of Washington has been a huge catalyst for the increase in volatility in stocks. That said, with all of the madness that is swirling around the Dow Jones Industrial Average (see chart here), the S&P 500 (see chart here) and the Nasdaq Composite (see chart here) have all managed to stay above their respective 200-day moving averages. This key technical support line has held true to form during these market selloffs. The small-cap Russell 2000 (see chart here) has not been as fortunate and could not hold its 200-day.

So in addition to the Washington D.C. threats of additional tariffs, the markets also had to deal with the dreaded 10-year and 2-year yield curve inverting. Whenever longer term interest rates fall below shorter term interest rates in the bond market that historically is a signal that a recession might be looming. Now there is a meaningful lag here whenever we see the yield curve inverting, so as long as the curve flattens out and returns to a normalized dynamic, we should escape the threat. However, if the yield curve remains inverted for an extended period of time then we could be in for something else.

Let’s get back to the technical shape of the markets. As mentioned, three of the four major averages held above their respective 200-day moving average support line which is a good thing technically. What also helped is during these meaningful selloffs is that the markets did go into oversold territory and technically bounced. Let’s see how the next couple of weeks shape up as we wind down the dog days of summer.

Good luck to all 🙂

~George

Happy New Year!

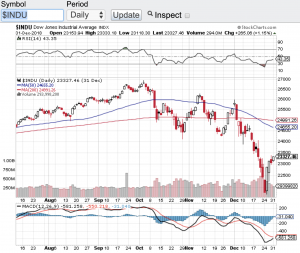
Happy New Year! Well if you have been long the markets and with the way stocks closed out 2018, it wasn’t so happy for the bull camp. However, a new year means new beginnings :-). Let’s do take a gander to see how the major averages fared in 2018. The Dow Jones Industrial Average ( click here or see chart below) finished the year down 5.6%, the S&P 500 (chart) closed the year down 6.2%, the Nasdaq Composite (chart) closed down 4% and the small-cap Russell 2000 (chart) closed 2018 down 12%. This is the worst performing year for stocks in a decade.

So what happened? In my view and simply put how can stocks go up in a straight line for over a decade without a correction? That’s right, stocks essentially have gone up for over 10 years’ without a healthy 20% correction. So when the markets finally had a real correction which is what occurred in the 4th quarter, it felt like the sky was falling. No question the Federal Reserve and rising interest rates have played a role in the market correction, however, let’s keep this in mind a 2-2.5% Fed funds rate is still historically low. What wasn’t normal over the past decade was a 0 percent interest rate policy and no market volatility. Everyone got spoiled with such an accommodative policy and market environment.

Another factor playing into the mix of the Q4 market correction is without question the trade war and tariffs that our President has ignited. This to me is even more of an issue to our economy than rising interest rates lifting to a normalized level. Not only is the trade war and its ramifications playing a role, but the inconsistency and chaos out of Washington are wreaking havoc on the markets.  No doubt in my mind that investors and Wall street are falling out of love with how our country is being governed, especially over Twitter. This is all fixable, we will just have to wait and see if the ego’s and the political agendas on both sides of the aisle can get the confidence back in our marketplace. Paula and I wish everyone the happiest and most prosperous 2019.  Good luck to all 🙂

~George

Dow Jones Industrial Average - George Mahfouz Jr

A Long Overdue Correction!

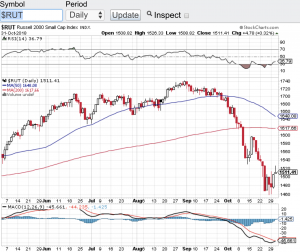
It was a spooky time for the equity markets in October as stocks experienced a long overdue correction. You have to go back seven years to have a month that sold off in the way the markets behaved in October. Yes, historically October has been one of the most volatile months of the year. The problem with historical data over the past several years is most of the time history has NOT repeated itself. Stocks have been on a tear for years breaking record after record. In fact not that long ago all of the major indexes had set all time record highs. Fast forward to today and we find the Dow Jones Industrial Average (chart) down almost 7% from its recent all-time high, the S&P 500 (chart) actually fell at one point over 10% from its all-time high finishing the month of October down 8%, the Nasdaq Composite (chart)  is down over 10% from its recent all-time high and the small-cap Russell 2000 (see chart below) is off over 13% from its all-time high recorded on August 31st of this year. So I think it is safe to say most of the market is in correction mode.

Next question, is this a healthy correction for the markets and will stocks find their bottom here or could this be the start of our first bear market in a decade? I guess the answer depends upon who you ask. I think it is too early to call out that a bear market is in the making, but one thing is for sure, we have not seen sustained volatility as we have witnessed recently in a very long time. As long as the trade war rhetoric continues to spew out of Washington and as long as the Federal Reserve keeps its foot on the gas pertaining to interest rates, I think the wild swings and volatility will continue. Oh yea, there is also this small event next week called the “mid-term elections” which should also play a key role in continuing vol. Good luck to all 🙂

~George

Russell 2000 - Paula Mahfouz

Finally Congress Gets a Deal Done!

After 16 days of a partial government shutdown, Congress finally came to terms to reopen the government and raise the debt ceiling. Talk about waiting until the last minute! Needless to say, stocks over the past couple of weeks have experienced an increase in volatility with triple digit gains and losses during the shutdown. Despite the turmoil in Washington, the Dow Jones Industrial Average (chart) on Wednesday closed up over 200 points, the Nasdaq (chart) managed to close at a 13 year high, the S&P 500 (chart) is nearing its all time high and the small-cap Russell 2000 (chart) finished the trading day at an all time record. Now the street can focus on Q3 earnings reporting season and so far, not so good.

After the close yesterday, bellwether International Business Machines (NYSE: IBM) shocked the street by missing revenues by almost $1 billion dollars and is down nearly seven percent in pre-market trading. Also after the close yesterday, Ebay (NasdaqGS: EBAY) reported in-line revenues, however guided lower for the upcoming holiday season. With Q3 earnings reporting season kicking into to high gear, I am questioning whether or not this will become the trend for the quarter? Most analysts do not expect this to be a robust quarter for corporate America, so now the question becomes does the imminent pullback in stocks become a buying opportunity before year end? Quite frankly with the headline risk out of Washington seemingly over for now, I beleive that the trend of pullbacks being bought will continue between now and year-end. I will look at key technical support levels for possible entries, and on the S&P 500 (chart) the 1680 zone appears to be the first level of support, which also happens to be its 50-day moving average, followed by the 1620 area. What gives me this vote of confidence of a continuing bull market into year-end is not necessarily how corporate earnings will fair, but the fact that the Federal Reserve continues to promise that it will do whatever it takes to support the economy, hence the bull market should continue. That said, when the Federal Reserve begins to taper, this will be the time that corporate America will truly need demonstrate top-line growth. In closing, no matter how your portfolio is positioned, it is usually the best practice to implement some type of protective stop initiative and of course always consult with a certified financial professional(s) while considering any investment strategy. Good luck to all. 🙂

~George


No deal, no problem?

Despite Washington’s inability to come to terms yet on the fiscal cliff, stocks continue to march higher this week. Today, the Dow Jones Industrial Average (chart) closed up 59.75 points and is up around 1.5% so far this week, the S&P 500 (chart) finished the day up 7.88 points, the Nasdaq (chart) +6.03 points and the small-cap Russell 2000 (chart) closed up 4.60 points.

With only six trading days left in the year, maybe all we need is the proverbial “Santa Clause” rally to close the year out on a high note. Hopefully, Washington can help Santa out and get some sort of deal done before year end, if not, the markets could be in for some rough sledding.

Have a safe and happy holiday season 🙂

~George

Stimulus to continue…

Stocks finished the week modestly lower despite the Federal Reserve extending its commitment to keep interest rates near zero. For the week, the Dow Jones Industrial Average (chart) closed lower by 20.12 points, the Nasdaq (chart) -6.71 points, the S&P 500 (chart) -4.49 points and the small-cap Russell 2000 (chart) was one of the sole indexes that managed to eke out a gain finishing the week up 1.48 points.

On Wednesday the central bank enhanced its accommodative policies by now tying the near zero interest rate environment to the unemployment rate vowing that interest rates will not increase until the unemployment rate in our country moves down to 6.5%. I think this creative move surprised most economists for never before has interest rates been directly tied to the unemployment rate. However, the market reaction was less than impressive to latest addition that the Fed made to its policy. My beleif is that until we get some sort of deal out of Washington on the fiscal cliff, not too much will be able to move the needle on these markets. That said, once we have clarity on the fiscal cliff dilemma, I will continue respect the power of the central bank and its ability to remain a significant force in our economy and our markets. In the meantime I will pay close attention to how the market action looks vis-a’vis the technicals on the key indices, and will be ready to deploy a long bias strategy once the coast is clear, Good luck to all.

Have a great weekend 🙂

~George