It’s A Broken Record!

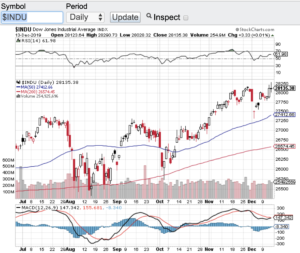
It’s a broken record indeed! That is the continuing record breaking run on Wall Street. On Friday the Dow Jones Industrial Average (see chart here), the S&P 500 (see chart here), the Nasdaq Composite (see chart here) set new all time highs. Seemingly, there is no stopping this record setting run that the markets have been on, at least for now. The latest catalyst was news out of Washington that the U.S. and China are close to coming to a “Phase 1” agreement on a trade deal. As I eluded to in my November 15th blog, new record highs could come into play by year-end if we see a trade deal happen. The caveat here is the deal is being titled as a “Phase 1” agreement and there is much more to agree upon to finish the deal out. That said, this is a definite step in the right direction and the markets seem to agree. I do want to keep my enthusiasm in check because of the volatility that continues to come out of Washington on this subject. We have all seen over the past several months tweets and statements out of Washington that we are close to a deal with China to only then wake up the next day to get the opposite statement either out of Washington or China. Phase 1 is a great step, but I am looking forward to the complete deal getting done and most likely that will yield to the first quarter of 2020.

In the meantime, investors are continuing to enjoy record highs and there doesn’t seem too much ahead between now and year-end that will change the course. The technical shape of the bellwether indexes remain intact. The Dow Jones Industrial Average (see chart below), the S&P 500 (chart) and the Nasdaq Composite (chart) are all trading below the 70 value level of the relative strength index (RSI). Also, each of these indexes are trading healthily above their 20, 50, 100 and 200 day moving averages.  

Paula and I wish everyone a very safe and happy holiday season.

~George
It's A Broken Record! - Paula Mahfouz


Happy New Year!

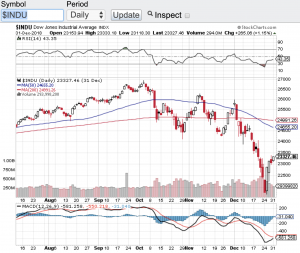
Happy New Year! Well if you have been long the markets and with the way stocks closed out 2018, it wasn’t so happy for the bull camp. However, a new year means new beginnings :-). Let’s do take a gander to see how the major averages fared in 2018. The Dow Jones Industrial Average ( click here or see chart below) finished the year down 5.6%, the S&P 500 (chart) closed the year down 6.2%, the Nasdaq Composite (chart) closed down 4% and the small-cap Russell 2000 (chart) closed 2018 down 12%. This is the worst performing year for stocks in a decade.

So what happened? In my view and simply put how can stocks go up in a straight line for over a decade without a correction? That’s right, stocks essentially have gone up for over 10 years’ without a healthy 20% correction. So when the markets finally had a real correction which is what occurred in the 4th quarter, it felt like the sky was falling. No question the Federal Reserve and rising interest rates have played a role in the market correction, however, let’s keep this in mind a 2-2.5% Fed funds rate is still historically low. What wasn’t normal over the past decade was a 0 percent interest rate policy and no market volatility. Everyone got spoiled with such an accommodative policy and market environment.

Another factor playing into the mix of the Q4 market correction is without question the trade war and tariffs that our President has ignited. This to me is even more of an issue to our economy than rising interest rates lifting to a normalized level. Not only is the trade war and its ramifications playing a role, but the inconsistency and chaos out of Washington are wreaking havoc on the markets.  No doubt in my mind that investors and Wall street are falling out of love with how our country is being governed, especially over Twitter. This is all fixable, we will just have to wait and see if the ego’s and the political agendas on both sides of the aisle can get the confidence back in our marketplace. Paula and I wish everyone the happiest and most prosperous 2019.  Good luck to all 🙂

~George

Dow Jones Industrial Average - George Mahfouz Jr

What a difference a year makes…

Last year at this time stocks were in a free-fall. At one point in August of 2011, the top four indicies were all down well over 10% on the month. Fast forward to this year and so far in August the Dow Jones Industrial Average (chart) is up 1.53%, the Nasdaq (chart) +2.77%, the S&P 500 (chart) +1.92% and the Russell 2000 (chart) +1.85%. It is very unusual for the markets to be posting gains in the dog days of summer. This is especially true when earnings reporting season has been less than stellar. Add into the mix a continuing flow of disappointing economic reports from around the world, and one would think we would be down 10% on the month!

So what gives? Call it an election year, call it the global flow of liquidity, call it what you want, but I am going to refer to the old adage on Wall street and that is “you can’t fight the tape!” This means when markets are trending lower or higher in this case, it’s best to go with the flow rather than try to pick the top to sell or sell short. However, it doesn’t make a lot of sense that we are at multi-month highs considering the global-macro picture. One thing is for sure, and that is stocks or indexes can remain overbought for extended periods of time regardless of the circumstances. Next week we will take a look at how the technicals are playing out in the markets to see if there is anything from a technical perspective that we should be paying attention to. Good luck to all.

Have a great weekend 🙂

~George