The Tariff Trade…
The tariff trade is now in play. Stocks ended the month lower in response to the White House confirming that tariffs on Mexico, Canada and China begin today. This has been no secret that tariffs would be imposed on select countries, but I guess reality sunk in went in was confirmed yesterday.
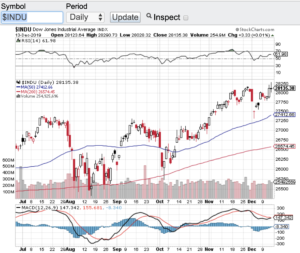
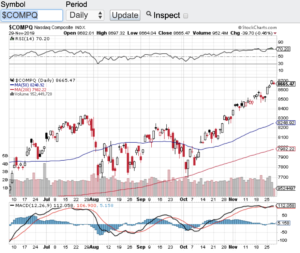
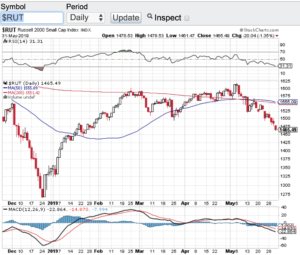
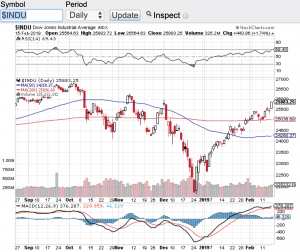
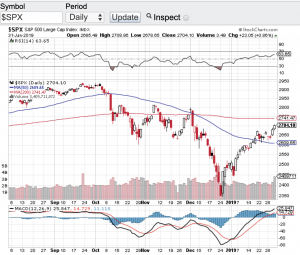
The Dow Jones Industrial Average (see chart here) closed the month of January down 337 points, the S&P 500 (see chart here) closed lower by 30 points, the Nasdaq Composite (see chart here) gave up 54 points and the small-cap Russell 2000 (see chart here) closed the month of January down around 20 points. Despite yesterday’s pullback, the month of January overall was a strong month for the markets.
When countries impose tariffs on each other consumers lose. The costs of tariffs typically is handed down to the consumer which will impact consumer spending and the economy. From fruits and vegetables, to lumber, to oil to cement, etc. the list goes on. Seemingly everything is about to get more expensive which of course will lift inflation. What a minute, aren’t things supposed to get cheaper and isn’t inflation supposed to be coming down? Clearly that isn’t happening now. Let’s hope that the political chess game does not go on for an extended period.
The sectors and stocks that will be most impacted by these newly issued tariffs are consumer discretionary stocks, materials stocks, the industrials, healthcare stocks and technology stocks. Yea, that’s pretty much our whole economy. So, time will tell how the markets will continue to react but it is pretty clear what will be happening here in the short term.
As I look at the technical shape of the major averages, they all remain solidly above their 200 and 100-day moving averages, but with yesterday’s selloff the key indices fell to their 20-day M/A and found support there before the market closed. Next week we will see if the support level can hold.
Good luck to all 🙂
~George