Tis The Season…

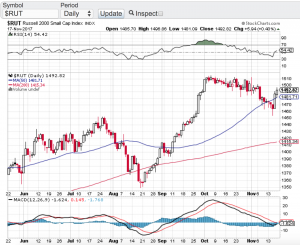
As the holiday season fast approaches stocks have a lot to be jolly for. Despite the recent pop in volatility, the major averages continue to enjoy their record setting ways. The Dow Jones Industrial Average (chart) closed the week at 23,258, the S&P 500 (chart) finished the week at 2,579, the tech focused Nasdaq composite (chart) closed at 6,783 and the small-cap Russell 2000 (see chart below) ended the week at 1,493 while recapturing its 50-day moving average.

Next week is a shortened trading week due to Thanksgiving. Historically the Thanksgiving holiday week tends to be a bullish week for equities with 75 percent of the time the markets finish higher. Add the seasonality factor into the mix and things look pretty good between now and year end. This doesn’t mean that things won’t be choppy along the way especially as the yield curve has many investors paying closer attention to it. Interest rate chatter is seemingly picking up lately despite the Federal Reserve being candid about their position and intentions. This will become further apparent when Fed chair Yellen speaks next week along with the release of the minutes from the last Federal Reserve meeting. All in all it appears that the status quo should be in place between now and year and if this is the case, new market highs should be set.

Earlier I spoke to how the small-cap Russell 2000 ( see chart below) has recaptured its 50-day moving average. This is important from the standpoint that investors and traders alike look to the Russell as a key indicator to the overall health of the broader markets. Recently the Russell has been showing some cracks in its trading patterns including noticeably breaking its 50-day only to recapture it and hold above it a few days later. If you are long this market, this is a bullish sign. That said, I do expect volatility to be present between now and year with the potential of making new highs along the way.

Paula and I wish everyone a very safe and Happy Thanksgiving 🙂

~George
Russell 2000 Paula Mahfouz

Russell 2000 – All Time High!

So now the small-caps join in! The Russell 2000 (chart) closed the week at an all time record high of 1490. For most of the year the widely followed small-cap Russell 2000 has lagged the other major averages. Now it has broken out, see (chart). In fact, when you look at the chart of the Russell, one can say this index has gone parabolic. The Nasdaq (chart) and the S&P 500 (chart) also closed at their all time highs on Friday, while the Dow Jones Industrial Average (chart) posted yet another positive week. What’s more is the month of September is typically one of the weakest months of the year for equities losing on average of 1.5% happening 70% of the time since the 1970’s. Not this year, in fact there have been so many record-breaking closes on all of the aforementioned indices it’s hard to keep track.

Question is, now what? With the third quarter of the year now in the books, Q3 earnings reporting season is right around the corner. I have got to believe with the Federal Reserve closing the chapter on their quantitative easing policy and now taking those assets off of their books, plus interest rates scheduled to rise, investors should pay closer attention to the health and growth of corporate earnings. Do you remember the days when earnings and earnings growth actually mattered? Well those days may be back upon us. Hence, the report cards that come in from corporate America may actually move the markets in a fundamental way. This we have not seen in almost a decade. However, if the market momentum that we have experienced since the election continues, and investors ignore the fundamentals, then why couldn’t we end the year at even higher highs?

One thing for sure is October will be filled with many catalysts that should bring in some volatility and a lot of opportunity.  Between now and year end may be the time to implement a hedged strategy where one can potentially profit regardless of how the indexes or individual stocks react to what’s ahead. I’ll cover this in my next blog. Good luck to all. 🙂

~George

The Bears Are Baffled!

What is historically one of the weakest months of the year for stocks, the S&P 500 (chart) closed the week and halfway point of the month at an all time high of 2500. The Dow Jones Industrial Average (chart) also closed the week at a record high, along with the tech-focused Nasdaq (chart) and last but not least, the small-cap Russell 2000 (chart) appears to be closing in on a new record high as well.

The bear camp has to be completely exhausted. I mean how in the world can you have the confidence to short this market? Not even the continuation of North Korea’s missile launches can slow down one of the most significant bull markets in history. Now seemingly we need to throw out all traditional metrics, seasonalities, geo-political risks, price to earnings ratios etc. This market has been immune to any risks. I have never seen anything like this. What’s more, there are survey’s out there that indicate that professional investors are the most pessimistic about the markets since before the election. You know what that means? Stocks tend to act the opposite of street sentiment.

Over the years and as most of you know one of my favorite technical indicators and one of the preferred technical indicators of money managers and institutional trader alike is the relative strength indicator. This indicator has been a trusted source to spot overbought and for that matter oversold conditions. The problem I have encountered this year is when indexes or individual equities have reached an overbought condition according to the RSI, the pullbacks that ensue have not provided the proper risk reward to any short thesis. The retracements are so shallow and short-lived that it is not worth putting the trade on. So needless to say, this strategy is on hold for now.

I am not sure what will be the catalyst for stocks or indexes to begin trading on pure fundamentals and not on the oversupply of liquidity and low interest rates. Until then, I will be very cautious in using the traditional metrics and/or technical indicators to base my decisions off of. Good luck to all 🙂

~George

Record After Record!

Another week in the books and records continue to fall. The Dow Jones Industrial Average (chart) and the S&P 500 (chart) both closed the week at record highs, while the Nasdaq (chart) and the small-cap Russell 2000 (chart) are within a stones throw from their all-time highs. These key indices have been setting records all year long. With the exception of a few minor pullbacks throughout the year, stocks have pretty much gone up in a straight line. This despite a very tepid economic recovery here in the United States with the GDP coming in at a modest increase of 1.4%.

I think it is safe to say that this latest record setting week was due in part to Federal Reserve Chairman Janet Yellen’s dovish comments regarding interest rates and that the Fed would be very gradual in its future hikes and that such action will be determined by how well the economy fares. If the latest retail sales numbers and consumer price index number are indicative of what the Fed will do, we may not see another hike until year end or even 2018? This is just what the markets needed in order to keep a floor not only under the stocks, but the confidence to proceed as business as usual hence record setting highs.

Well the old adage of you can’t fight the tape or the Fed for that matter is certainly playing out so far in 2017. Are there any catalysts out there that could change the markets mind or its direction? Well we are about to enter the busiest week of Q2 earnings reporting season so far with over 440 companies reporting their results next week including the likes of Netflix (NasdaqGS: NFLX), Goldman Sachs (NYSE:GS), International Business Machine (NYSE: IBM), Johnson & Johnson (NYSE: JNJ), United Airlines (NYSE: UAL), American Express (NYSE: AXP), eBAY INC. (NasdaqGS: EBAY) and General Electric (NYSE: GE) just to name a few. The following week over 1400 companies will report their quarterly results. So if there is anything that could slow this bull market down right now this is it. However, if corporate America continues to report solid earnings results, new record highs could very well continue into the foreseeable future. Good luck to all 🙂

~George


As Expected, The Fed Raises Rates…

To no surprise, the Federal Reserve raised interest rates 1/4 point today citing stronger economic growth and a pick-up in inflation. A stronger job market also played a role in the decision of the Fed. What wasn’t quite expected was the language of an additional anticipated rate hike from the projected two hikes in 2017 to now three. This might of caused the slight sell-off yesterday in the markets with the Dow Jones Industrial Average (chart) falling 118.68 points, the S&P 500 (chart) was lower 18.44 points, the Nasdaq (chart) fell 27.15 points and the small-cap Russell 2000 (chart) retraced by 17.51 points.

With all things considered, this pullback was long overdue. In fact, I am surprised that the markets held up like they did yesterday. Especially considering the rip roaring rally most equities have enjoyed since the presidential election. Markets have been on fire with the Dow Jones Industrials (chart) gaining almost 1,600 points, the S&P 500 (chart) ripping 125 points, the Nasdaq (chart) catapulting about 300 points and the small-cap Russell 2000 (chart) up a staggering 170 points. What a breathtaking rally in such a short period of time.

So what can we expect between now and year end? Let’s think about this for a minute. If you are an institutional investor, fund manager, hedge fund or the like would you be taking profits into year end? Or would you wait until we get into the new year knowing that capital gains taxes and corporate taxes are coming down? I think it is fair to say the latter would make the most sense. Add into the mix the rotation that continues out of the bond market and into equities in which certain pundits believe we are in the fourth or fifth inning of that rotation, one has to ascertain that this bull market has more room to run.

Whatever the case I think pullbacks will be bought as momentum continues into year-end. Paula and I wish everyone the happiest and healthiest holiday season 🙂

~George

All Eyes On Jobs Report…

The chatter has increased lately as to when the Federal Reserve will raise interest rates from their historic lows. We may not need to wait much longer to get that answer. Although it is a holiday weekend, the August jobs report will be released tomorrow and the pundits are suggesting that if the economy added more than 200,000 jobs in August, the Federal Reserve will raise rates this month. From my view a quarter point rate hike here in September is no big deal. I think the markets will have a muted reaction. However, if this is the beginning of a consistent pattern then this becomes an entirely different discussion. I do not expect that the Fed will be too aggressive with future rate hikes and of course the economic data will play a role in those decisions.

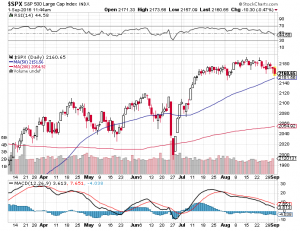
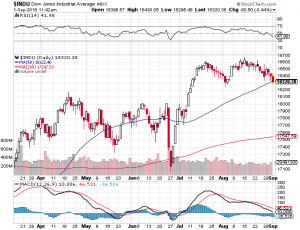
So what about the markets? We are coming into a seasonality that is typically a weaker time for stocks. What’s more, the markets will also begin to focus on the presidential election and the polls associated with it. That said, I expect an increase in volatility as we head into the fall. There are other catalysts that could weigh in on stocks such as potential changes in global monetary policies and Q3 earnings reporting season in October. The key indices continue to demonstrate strength with the S&P 500 (see chart below) being supported by its 50-day moving average click here, the Dow Jones Industrial Average (see chart below) is within a couple percentage points of its all-time highs, and both the Nasdaq (chart, click here) and the small-cap Russell 2000 (chart, click here) are trading right around their 20-day moving averages. So as of yet, stocks do not appear to be too concerned with the upcoming market seasonality and other potential catalysts that could play a role in interrupting the uptrend we have been in.

Both Paula and I wish everyone a very safe and happy Labor Day weekend 🙂

~George

S&P chart george mahfouz jr

dow jones chart george mahfouz jr

Stocks Are Back!

Since losing over 10 percent of their values and going into correction territory earlier this year, the major averages now find themselves almost back to par. Year-to-date the Dow Jones Industrial Average (chart)  is only down around one percent, the S&P 500 (chart) is also lower by around one percent, the Nasdaq (chart) on the year has gained back over half of its losses and the small-cap Russell 2000 (chart) is lower by 4.5%. Since this bull market began over seven years ago, time and time again stocks have demonstrated astounding resilience. Seemingly every time there is a sell-off, willing buyers are ready to step in at varying support levels and buy up equities.

Today the Federal Reserve left interest rates unchanged and actually slashed their forecast to project only two additional rate hikes for the rest of this year versus the four rate hikes they had originally targeted. Stocks initially popped on the news and only one can conclude that the continuing accommodating monetary policies not only here in the United States, but from around the world is most likely the reason why this seven year bull market continues.

That said, the aforementioned indices are approaching overbought conditions according to the relative strength index. Remember the RSI is one of the favorite technical indicators by market technicians, certain algorithmic programs and institutional investors alike. The relative strength index measures and compares the size of moves in a selected period of time and according to the RSI, the 70 or greater value level signals an overbought condition and the 30 value level or lower indicates an oversold condition. Keep in mind stocks and/or indexes can remain overbought or for that matter oversold for an extended period of time. Currently the Dow Jones Industrial Average (chart) is almost touching the 70 value level and the other indexes are not too far behind. Of course this is only one of many technical indicators that traders and investors utilize, but I have found over the years the RSI is one of the more reliable indicators out there.

Good luck to all 🙂

~George

Despite A Month End Rally, Stocks Took It On The Chin!

January proved to be one of the toughest months for stocks in years. The Dow Jones Industrial Average (chart) closed the month down 5.5%, the Nasdaq (chart) closed down 8%, the S&P 500 (chart) fell 5.1% and the small-cap Russell 2000 (chart) finished the month out down almost 9%. If it wasn’t for the strong month end rally, both the Nasdaq (chart) and the small-cap Russell 2000 (chart) would of closed out in correction territory. Clearly China and Oil continue to grab the headlines and continue to make investors very nervous. However, on Friday the Bank of Japan in a surprise move implemented negative interest rates for the first time ever in an attempt to aggressively stimulate their struggling economy. So once again a central bank acts and the markets respond. Even our own Federal Reserve stated last Wednesday that they are on high alert pertaining to the global markets and the affects that are being felt here at home. In other words, there may be a pause in raising interest rates here in the U.S.?

That said, what never ceases to amaze me is how technically disciplined the markets can be. If you look at the major averages over the past two weeks you will see that all of these key indices held their August 2015 lows. Especially the Dow (chart) and the Nasdaq (chart) which traded down almost to the nickel to their respective August lows. In my previous blog I cited the Federal Reserve and their policy shift to raising interest rates and the fact that now markets and equities can be assessed on their own merits versus what the central banks may or may not do. Well Friday’s Bank of Japan’s move is a reminder that central banks around the world are ready and capable of intervening at any point in time. Which brings me back to this, how in the world can you confidently have a short thesis in these markets? In my opinion, this model is simply too risky when you have monetary policies that can turn on a dime.

So what’s an investor or trader to do? One thing that stands out to me is throughout all of the noise and chatter is that the technicals continue to perform with the utmost efficiency. Whether markets or equities are overbought or oversold vis-à-vis the relative strength index (RSI) , or support lines are met and hold. No one can deny how disciplined and efficient technical analysis can be.

Good luck to all 🙂

~George

Is It A Looming Rate Hike, Or Something Else?

After posting blistering gains in the month of October, stocks took it on the chin last week and it’s technically looking like more short-term downside could be in the cards. For the week, the Dow Jones Industrial Average (chart) lost 665 points, the Nasdaq (chart) retraced 219 points or 4.3%, the S&P 500 (chart) -76 points and the small-cap Russell 2000 (chart) closed lower on the week by 53 points or 4.4%.

Seemingly, the start of the selling pressure accelerated when the October labor report came out surprisingly strong. This report was released on November 6th. One could say that this is the main reason stocks have been under pressure. Pundits are now calling with almost certainty that the Federal Reserve has the green light to raise interest rates at their next meeting in December. Couple this will commodity prices continuing to fall, in particular oil, which is down recently almost 10% and you can understand why the markets would be under pressure. Or could it be the simple fact that October saw almost 10% gains across the board and the key indices were overdue for a pullback. I’d like to add to the mix that the latest round of economic numbers could also be weighing in on investor sentiment. This is evidenced by a weaker than expected retail sales number and weak retail earnings reports issued last week along with a very weak Producer Price Index. Sum all of this up and it’s no wonder the aforementioned indexes closed lower by almost five percent last week. From a technical perspective the key indexes have now breached their respective 200-day moving averages and if you are bullish, you would want to see the markets recapture this key technical support line and return to the uptrend that was intact throughout the month of October.

As the Thanksgiving Day holiday fast approaches, both Paula and I wish everyone a very safe, healthy and Happy Thanksgiving 🙂

~George

Happy New Year!

The bull run continues for the stock market which posted yet another year of gains in 2014. However, not quite the eye-popping 30% performance that the major averages experienced in 2013. Nonetheless, in 2014 the Dow Jones Industrial Average (chart) gained 7.52%, the Nasdaq (chart) advanced 13.4%, the S&P 500 (chart) gained 11.39% and the small-cap Russell 2000 (chart) finished the year up a modest 3.52%.

Looking ahead to 2015, simply put, if the Federal Reserve stands pat and does not raise interest rates, stocks here in the U.S. should continue to head north. Of course should the U.S. economy continue to expand and the job market continue to improve, we should begin to see rates inch up, which could possibly slow this six-year bull market down. I think the velocity of any rate increases will be the main factor as to how the markets would react. A slow and steady course should not disrupt stocks too much, however, if the fed surprises the street by raising rates too aggressively, then we could be in for a very volatile year. Whatever the case is, I also believe in 2015 the street will be looking more closely to the top-line growth of corporate America in order to justify the lofty average P/E ratio of S&P 500 companies. The current P/E ratio of the S&P is around 18 compared to the historic average of around 15.

Let’s now take a look at the current technical set-up of the aforementioned indices. The Dow Jones Industrial Average (chart), the Nasdaq (chart), the S&P 500 (chart) and the small-cap Russell 2000 (chart) all remain below the 70 value level of the relative strength index (RSI) The 70 value level of the RSI is considered overbought territory. In addition, these indexes are also trading above their 20, 50 and 200-day moving averages which is considered support zones of this particular technical indicator, especially the 200-day moving average. So technically speaking, stocks appear to be on solid footing heading into 2015. That said, Paula and I wish everyone a very safe, prosperous and Happy New Year 🙂

Sincerely,

~George