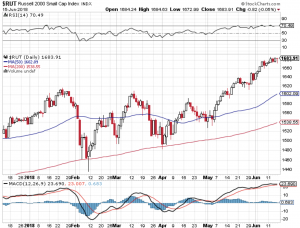
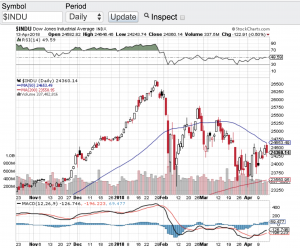
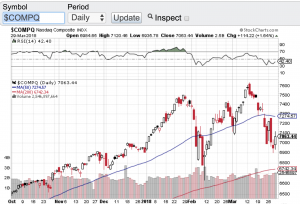
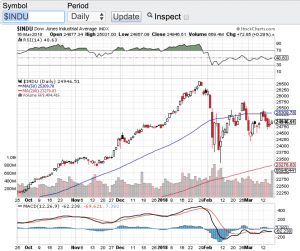
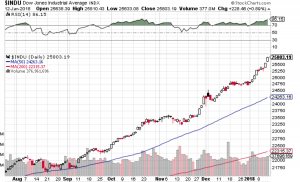
There is no question the economy is booming but what does this mean long term for stocks? When the economy is firing on all cylinders like it is now here in the United States one may think the stock market must be ready for its next leg up! Not so fast. Historically when the economy heats up and the unemployment rate becomes so low, that does not typically bode well for stocks. Why you ask? Simply put, the Federal Reserve does not want inflation to rear its head up and their main tool to avert inflationary pressures is to raise interest rates. As counterintuitive as it may seem, a strong economy and low unemployment may be the catalyst to put the brakes on this almost 10 year bull market run. That said, the major averages continue to show extraordinary resilience no matter what comes at it. The Dow Jones Industrial Average (chart) closed the week above 25,000, the S&P 500 (chart) finished the week at 2779, the Nasdaq Composite (chart), finished near its all time high and the small-cap Russell 2000 (see chart below) closed the week out a few points away from it’s all time high as well.
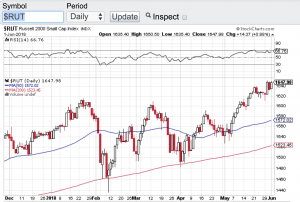
It is quite remarkable how the aforementioned indexes are behaving with all things considered. This past week the Federal Reserve raised interest rates again and signaled two more hikes this year and the trade war chatter and action with China and our own allies for that matter is accelerating. Just these two events alone show be putting selling pressure on stocks not setting new record highs as is the case this past week with the Nasdaq Composite (chart) and the Russell 2000 (chart). These indexes also remain well above key moving averages which at some point in time reversion to the mean should occur. I will be looking for opportunities on the short side but will continue to respect the fact that this years-long bull market remains intact at least from a technical standpoint. Good luck to all 🙂
~George