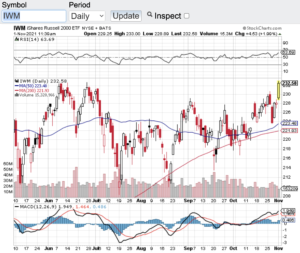
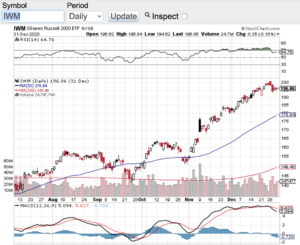
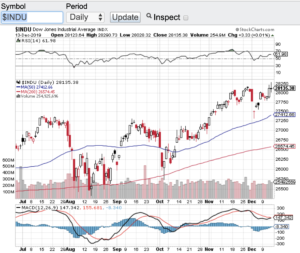
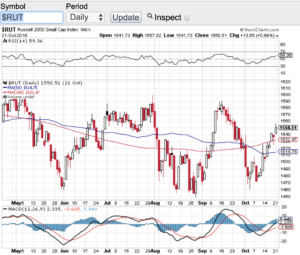
Big Tech Blowout!

Big tech absolutely blew out their earnings in their most recent quarter. Let’s start with Apple; Apple (NasdaqGS:AAPL) experienced growth in each of its product categories. What’s truly unbelievable is Apple generated about a $billion dollars a day in revenue. Yes, no typo folks, a billion a day in revs in their most recent quarter. Facebook (NasdaqGS: FB) also crushed their quarter generating over $26 billion in revenues easily beating analysts expectations of $23 billion and Facebook’s earnings per share exceeded analysts’ expectations by 40%. Alphabet’s (NasdaqGS: GOOGL) quarter was also quite stellar posting revenues of $55 billion which is up over 30% from the same period a year ago and last but not least Microsoft (NasdaqGS: MSFT) posted revenue of over $41 Billion up almost 20% over for the same period last year. To me this is breathtaking on how these mega-cap companies continue to grow at such a high clip completely ignoring the “law of large numbers”Β .

So off to the races for the aforementioned stocks right? Not so fast. Despite popping after releasing their earnings, these stocks have started to trade lower. This could be a sign that these earnings reports were already baked into the price already. Of course, it is not uncommon for stocks to become a bit exhausted especially after the tear that the markets have been on so far this year. Let’s see how next week fares in whether or not the lack of follow through to the upside now that earnings are out.

As I look at the overall technical shape of the markets the Nasdaq Composite (see chart here), the Dow Jones Industrial Average (see chart here), the S&P 500 (see chart here) and the small-cap Russell 2000 (see chart here) are not currently overbought according to the relative strength index. What’s more is these indexes also remain comfortably above their respective 100 and 200 day moving averages and are finding current support at their 20-day MA.

Good luck to all πŸ™‚

~George


Does It Feel A Bit Bubbly?

Do the markets feel a bit bubbly to you? This question is beginning to surface more frequently lately and I think it’s a great question to be asking. The majority of asset classes seemingly have gone straight up without pause over the past several months. Whether it’s the stock market as a whole, the crypto space or one of the hottest trends lately are SPAC’s. What is a SPAC? A SPAC is a special purpose acquisition vehicle that is publicly traded but has no assets other than cash. These vehicles are specifically designed to form as a public company, raise capital and then seek out companies to acquire. For example the electric vehicle space has been one of the favorite sectors for SPAC’s to target over the past year. This is a much easier pathway for private companies to go public without having to go through the time and expense of a traditional IPO.

One of the problems that is happening with the SPAC trade is once they identify a target and move to acquire it, the valuations of these SPAC’s begin to rise steadily into the nosebleed section of the markets. So much speculation is occurring with these SPAC’s institutional and retail investors are willing to pay essentially any price to get on board. Let’s not forget about the day traders that add fuel to the rise in these SPAC’s. So between all of the above and now with interest rates starting to tick up, it’s now wonder we have witnessed over a 1000 point drop in the Dow Jones Industrial Average (see chart here) to close out last week. Now let’s look at the technical shape of the major averages.

The Dow Jones Industrial Average (see chart below), the S&P 500 (see chart here), the Nasdaq Composite (see chart here) and the small-cap Russell 2000 (see chart here) over the past few trading sessions have all dropped below their respective 20-day moving averages and are finding support at their 50-day. Let’s see if these key indices can hold their 50-day moving average support zone this week. If they can the uptrend could very well remain intact, if not, we could see late last weeks selling pressure continue.

Good luck to all πŸ™‚

~George

Does It Feel Bubbly? - Paula Mahfouz

2021 Is Here…

2021 is here and it could not of come fast enough. Happy New Year and I think we can all use a fresh start! The year 2020 was one of the most challenging years our country and the world has faced. One of the only exceptions that did not face many challenges is the stock market. Despite the global pandemic we remain in and the non-stop chaos out of Washington DC, the major averages set record highs throughout the year. Who would of thought that stocks and market speculation would be at such a fever pitch considering the backdrop of 2020. During this latest bull market surge one thing that stands out to me is how margin debt has hit all time highs. Investors have borrowed over $700 billion dollars against their portfolios which is also a new record. This is somewhat alarming because when the market experiences a correction, margin debt can accelerate any meaningful selloff. Some investors could be forced to sell if their margin debt becomes disproportionate to their overall account value. That said, when record highs continue to be set the risk of margin debt tends to be overlooked.

Speaking of record highs, both the Dow Jones Industrial Average (see chart here) and the S&P 500 (see chart here) set new records on the last trading day of the year. The Nasdaq Composite (see chart here) and the Russell 2000 (see chart below) also set records earlier in the week. Although stocks and indexes feel overbought, we are not seeing extreme overbought conditions according the the relative strength index also know as the RSI. There is also support in place at the 20-day, 50-day, 100 and 200-day moving averages. So technically speaking the key indices appear to be in good shape. This set-up bodes well for the continuation of the market rally that we are in.

Of course there are risks out there that could temper the record setting enthusiasm. One risk in particular is the upcoming runoff election in Georgia next week. If the democrats take control of the Senate, this could be viewed as a negative for stocks. The markets historically have liked when there is a split majority between the House and Senate. Pundits argue that a Democratic President and a Democrat controlled Congress could affect income and capital gains taxes that would negatively impact stocks. I am not sure if this will play out but nonetheless as we continue down this bull market path we should not be lullabied to sleep with the risks out there. Good luck to all πŸ™‚

~George

2021 Is Here - Paula Mahfouz

Fear Of A Global Pandemic Grips Markets!

Stocks went into a tailspin as fear of a global pandemic grips the markets! New outbreak clusters of the highly contagious coronavirus are beginning to surface which is pressuring leaders from around the world to act and act more aggressively. Stocks have also entered correction territory as companies and analysts begin to ratchet down their revenue and earning forecasts. Over the past week or so the Dow Jones Industrial Average (see chart here) has lost over 10% in the past week alone, the S&P 500 (see chart here) has also entered into correction mode, the Nasdaq Composite (see chart here) has been hit hard and the small-cap Russell 2000 (see chart here) is also witnessing a sharp sell-off.

Personally I believe a correction was needed because of how robotic the markets have acted. Stocks no matter what risks were out there behaved in a way never before seen. We have been in the strongest bull market ever and nothing over the past 12 years could slow this bull market down. Now I am not happy that it is a global health risk that’s the catalyst to put stocks in correction mode, but nonetheless this is where we find ourselves. Of course when fear is rampant in any market this is where opportunity can be found. I am not suggesting to jump in here because as we all know fear and/or greed can be excessive and markets tend to over do it when emotions take the lead over rational thinking. So when we get overextended to the upside or downside the first thing I look at is how the technicals look during extreme market moves.

When I now look at the technical shape of the markets at least at it pertains to the moving averages things do not look so good. The Dow Jones Industrial Average (see chart here), the S&P 500 (see chart here) and the Russell 2000 (see chart here) have all breached their 20-day, 100-day and 200-day moving averages which are all seen as major support zones especially the 200-day. The Nasdaq Composite (see chart here) is the only major index that has yet to close below its 200-day. That said, all of the aforementioned indexes are oversold according to the relative strength index (RSI) which when we see the 20 value level hit on any stock or index, snap back rallies can and do occur. This type of market is great for traders if you are experienced enough to trade off of technicals, however for investors that have a long term view these type of market environments requires a lot of patience and keeping the emotions at bay. Let’s all hope that the spread of the coronavirus abates and that a vaccine becomes available as quickly as possible.

Good luck to all πŸ™‚

~ George

It’s A Broken Record!

It’s a broken record indeed! That is the continuing record breaking run on Wall Street. On Friday the Dow Jones Industrial Average (see chart here), the S&P 500 (see chart here), the Nasdaq Composite (see chart here) set new all time highs. Seemingly, there is no stopping this record setting run that the markets have been on, at least for now. The latest catalyst was news out of Washington that the U.S. and China are close to coming to a “Phase 1” agreement on a trade deal. As I eluded to in my November 15th blog, new record highs could come into play by year-end if we see a trade deal happen. The caveat here is the deal is being titled as a “Phase 1” agreement and there is much more to agree upon to finish the deal out. That said, this is a definite step in the right direction and the markets seem to agree. I do want to keep my enthusiasm in check because of the volatility that continues to come out of Washington on this subject. We have all seen over the past several months tweets and statements out of Washington that we are close to a deal with China to only then wake up the next day to get the opposite statement either out of Washington or China. Phase 1 is a great step, but I am looking forward to the complete deal getting done and most likely that will yield to the first quarter of 2020.

In the meantime, investors are continuing to enjoy record highs and there doesn’t seem too much ahead between now and year-end that will change the course. The technical shape of the bellwether indexes remain intact. The Dow Jones Industrial Average (see chart below), the S&P 500 (chart) and the Nasdaq Composite (chart) are all trading below the 70 value level of the relative strength index (RSI). Also, each of these indexes are trading healthily above their 20, 50, 100 and 200 day moving averages.Β Β 

Paula and I wish everyone a very safe and happy holiday season.

~George

It's A Broken Record! - Paula Mahfouz


Third Rate Cut Of The Year…

The Federal Reserve provided its third rate cut of the year on Wednesday. Although this was very much expected, until it happens you don’t know. Without question the Fed’s actions this year has helped the markets hit new highs throughout the year. This week has been no different. Despite pulling back a bit yesterday the Dow Jones Industrial Average (see chart here) remains above 27000, the S&P 500 (see chart here) hit a fresh all-time high on Wednesday, the Nasdaq Composite (see chart here) is within 50 points of its all time high and the small-cap Russell 2000 (see chart below) is trading above its 20, 50, 100 and 200-day moving averages. A technically healthy sign.

What has allowed the Federal Reserve to be proactive in cutting rates is the fact that inflation is pretty much non-existent. If inflation was present in a meaningful way I am not sure the Fed would be cutting rates at all. A huge side effect to lower rates is a strong stock market. So it’s no wonder we continue to trade at new highs and at the very bare minimum hold strong near the upper bands of the trading range. A couple of other factors that are supporting the markets are the latest round of corporate earnings reports which are coming in a bit better than expected along with some positive news flow out of the China trade negotiations.

With this latest rate cut I would not be surprised to see a continuation of the current upward trend and also potentially see new all-time highs before year-end. As I look at the technical shape of the aforementioned indexes pertaining to the relative strength index and the moving averages, I don’t see any issues there either. The Dow Jones Industrial Average (chart), the S&P 500 (chart), the Nasdaq Composite (chart) and the Russell 2000 (chart) are all above their respective moving averages which historically provides support on pullbacks and none of these indexes are in overbought territoryΒ  according to the relative strength index (RSI) principles.

Good luck to all πŸ™‚

~George

Third Rate Cut Of The Year - Paula Mahfouz


New Week, New Record Highs?

New week, new record highs? The Dow Jones Industrial Average (see chart here) and the S&P 500 (see chart here) are fast approaching all-time highs. Both of these major indexes have been on a tear of late and could see new record highs this upcoming week. However, breaking news came out yesterday that Saudi Arabia has shut down half of its oil production after drones attacked the world’s largest oil processing facility. This attack will impact 5 million barrels of daily oil production. One sector that will certainly be affected is the energy space. The price of oil is now expected to skyrocket at least here in the short term. I am not sure if the markets will shrug this dynamic off, but I do expect energy stocks to outperform.

As I take a look at the Nasdaq Composite (see chart here) and the small-cap Russell 2000 (see chart here) both of these indexes appear to be ready to breakout and join the Dow Jones Industrials and the S&P 500 most recent performances. If the news out of the middle east has a negative impact on stocks, there are plenty of technical support levels that would come into play. All of the aforementioned key indexes are trading comfortably above their 20-day, 100-day and 200 day moving averages. During the month of August the 200-day moving average provided major support multiple times. As I look at the relative strength index to see how close we are to overbought conditions, there is still plenty of real estate before we see the 70 level of the RSI. So technically speaking the indexes appear to be in relatively good shape.

Without question the oil markets and the energy sector will be the focus this week. I am also curious to see how the overall markets react to this latest development out of the middle east. Good luck to all πŸ™‚

~George


First Rate Cut In Over A Decade!

Yesterday the Federal Reserve conducted its first rate cut in over a decade! Although widely expected, the markets were disappointed as to how Fed Chairman Jerome Powell signaled that this is does not necessarily mean more rate cuts are forthcoming. Chairman Powell’s statement sent stocks down sharply. The Dow Jones Industrial Average (see chart here) closed down over 330 points, the S&P 500 (see chart here) closed lower by 32.80, the Nasdaq Composite (see chart here) finished down almost 100 points and the small-cap Russell 2000 (see chart below) finished the day down 11 points. The markets were hoping that Mr. Powell would remain dovish and it was clear he was the opposite. That said, a rate cut is a rate cut and the intention is to keep the economy moving. Despite the rate cut move, The White House came out and complained about how Chairman Powell handled his statement and it is no secret that administration wants further rate cuts. I do think additional rate cuts may not be needed due to how Q2 earnings reporting season is going so far. The street was expecting an “earnings recession” at least in the last quarter. But as we are now half way through earnings reporting season, so far so good. There are not many earnings surprises to the downside and future guidance is not too shabby so far.

Let’s take a look at the current technical shape of the markets. The indexes have been going sideways as of late with the exception of yesterday’s selloff. That said, yesterday’s selloff did break the 20-day moving averages of the Dow Jones Industrials, the S&P 500 and the Nasdaq Composite, however, the small-cap Russell 2000 closed above its 20 day and actually demonstrated more relative strength than the other averages. A one day selloff does not necessarily mean the beginning of a new downward trend so let’s wait and see how the rest of earning reporting season goes and then we can assess how the back half of the year shapes up.

Good luck to all πŸ™‚

~George

Russell 2000 - Paula Mahfouz


Fed Rate Cuts Back In Play?

The question over the past week or so is whether or not Fed rate cuts are back in play? The May jobs numbers were way below expectations with the economy only adding 75,000 jobs. This is a far cry from the 180,000 that economists were expecting in the month of May. As intuitive as it seems a weak jobs report should equal a continuing sell-off in the markets. Not the case in the first half of the month for stocks. In fact the Dow Jones Industrial Average (see chart here), the S&P 500 (see chart here), the Nasdaq Composite (see chart here) and the small cap Russell 2000 (see chart below) all have rallied sharply so far this month. So how is it that stocks are rallying with a slowing job market? Two out of the past four months the jobs number has come in below 100,000. This is giving hope to the markets that the Federal Reserve may actually start cutting interest rates as opposed to raising them and this is why the markets are rallying. Lower interest rates has been a boon for stocks for the past decade and if the Fed starts lowering rates again, we could see all-time highs again.

What’s more is the technical shape of the aforementioned key indexes. As stocks have rallied this month, 3 out of the 4 major averages have blown through their moving averages which can provide resistance point if a stock or index is trading below their respective averages. Since the June rally began, the Dow Jones Industrial Average (click here for chart) recaptured it’s 200-day, 100-day and 20-day moving averages as did the S&P 500 ( click here for chart) and the Nasdaq Composite (click here for chart). However the small-cap Russell 2000 (click here for chart) has run into its 100 and 200 day moving averages and has found resistance at these key pivot points.

Let’s see how the rest of June goes and see if this past weeks consolidation will offer yet another leg up in the markets. Good luck to all πŸ™‚

~George

Russell 2000 - George Mahfouz Jr

Now Mexico Too?

If it wasn’t enough to hit China harder, now Mexico too? Look by no means am I an expert on trade, tariffs or politics, but one thing I do know the stock market doesn’t like what has been going on with all three! The stock market also dislikes uncertainty and curve balls and this administration is certainly throwing a lot of both out there lately. Stocks have taken it on the chin with yet another wave of selling this week. For the first time since January the Dow Jones Industrial Average (see chart here) has fallen below the 25,000 mark. The S&P 500 (see chart here) closed in the 2,750 zone, the Nasdaq Composite (see chart here) closed near the 7,450 level and the small-cap Russell 2000 (see chart below) closed at 1,465.

What’s more eye catching to me is that all of the major averages have now fallen below their respective 200-day moving averages. Let’s do take a look at the technical shape of the market to see how much damage has been done. Now that the 200-day moving averages have been breached lets look at the RSI of each index. The relative strength index is a technical indicator that expresses whether or not a stock or index is overbought or oversold (click here for RSI). The Dow Jones Industrials (chart), the S&P 500 (chart), the Nasdaq Composite (chart) and the small-cap Russell 2000 (chart) all are racing toward the oversold level of 30. In fact, the Dow Jones breached the 30 level of the RSI yesterday.

Historically when stocks or indexes break their key support levels and head down towards the 30 level of the RSI, there is usually a continuation through that metric as well. That said, history does not always repeat itself but I would also not be surprised to see more selling pressure in the near future. Good luck to all πŸ™‚

~George

Russell 2000 - Paula Mahfouz