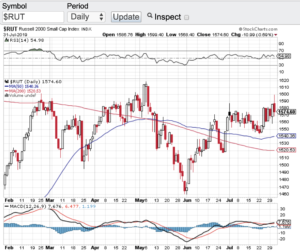
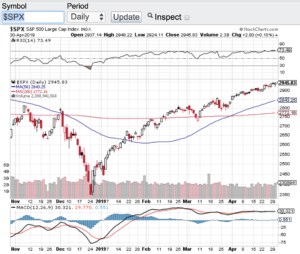
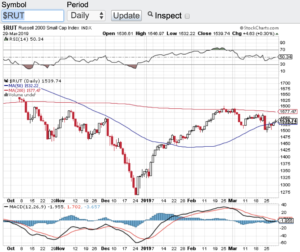
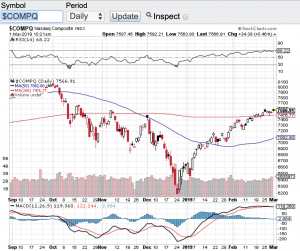
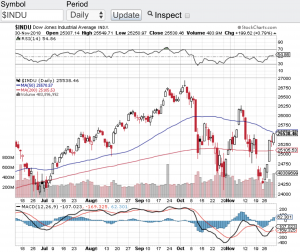
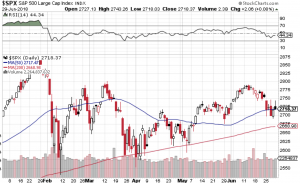
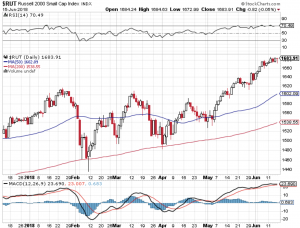
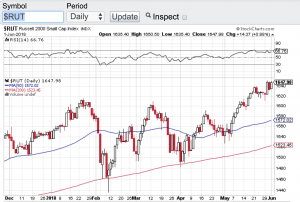
Strong Economy Equals A Strong Stock Market!

The economy posted a 3.2% gain in the first quarter and as the saying goes, a strong economy equals a strong stock market! Is it any wonder as to why the Nasdaq Composite (see chart here) hit an all-time high on Monday! The same rings true with the S&P 500 (see chart below). The S&P 500 hit an all-time high on Monday as well. Now the Dow Jones Industrial Average (see chart here) has a bit more work to do in order to tap its own record as does the small-cap Russell 2000 (see chart here). However, I am sure the bulls will take 2 out of the 4 major averages setting all time highs. What is also helping the stock market is how the Federal Reserve has taken a cautious approach to raising rates any further. In fact, there are calls out of Washington DC asking the Fed to start lowering rates to stimulate the economy even further. Now I am not so sure that the Fed will accommodate Washington’s request, but I do think it is safe to say that we should not see a rate hike in the near future or maybe not at all for the rest of this year.

One note of caution to me is that with nearly half of corporate America reporting their Q1 earnings so far, we are seeing on average a year over year decline in earnings. There are still 100’s of companies set to report over the coming weeks but if this trend continues, this will be the first year over year decline in corporate earnings in years. I will be keeping an eye on this development.

The technical shape of the aforementioned indexes remain intact. The Dow, Nasdaq, S&P 500 and the Russell 2000 all are trading above their respective key moving averages. However, both the Nasdaq Composite (see chart here) and the S&P 500 (see chart here) have entered into overbought territory according to the relative strength index also know as the RSI. That said, I would not be surprised to see at the very least some consolidation or an outright healthy pullback. Good luck to all 🙂

~George

S&P 500 - Paula Mahfouz

Stocks End Q1 On Fire!

Stocks ended the first quarter of the year on fire! The Dow Jones Industrial Average (see chart here) closed Q1 up over 11%, the S&P 500 (see chart here) closed the first quarter up over 12% which is the best performing quarter in years for this bellwether, the Nasdaq Composite (see chart here) closed up more than 17% and the small-cap Russell 2000 (see chart below) closed out the first quarter of the year up over 14%. Yes folks these gains are incredibly impressive especially considering how global growth is slowing. That said, these eye-popping market gains are not too surprising considering the sharp sell-off that stocks experienced in that latter part of 2018. Without a doubt the aforementioned indexes were way oversold in late December and an oversold bounce of some sort was definitely in the cards. As we know, market swings can and do overshoot to downside such as what we saw in late 2018 and now the question is, will we overshoot to the upside?

It sure does not appear that way at least from a technical perspective and according to the Relative Strength Index (RSI). The Dow Jones Industrial Average (see chart here), the S&P 500 (see chart here), the Nasdaq Composite (see chart here) and the small-cap Russell 2000 (see chart here) are no where near overbought conditions yet. This despite all of these key indices rallying double digits in Q1. What’s more, all but one of these indices are also trading above their key moving averages including their 20-day, 100-day and 200-day with the lone exception being the small-cap Russell 2000. Now there could be some consolidation going on here over the next few weeks and up until first quarter earnings reporting season begins which would actually be healthy for the markets.

Speaking of the upcoming earnings reporting season, this could be the one catalyst that sheds the most light for the rest of the year on how stocks will fare. It is no secret global growth has slowed and I think corporate America will speak to whether this current global slowdown is just a blip on the radar or something much more meaningful.

Good luck to all 🙂

~George

Russell 2000 - Paula Mahfouz


Best Start Of The Year In Decades!

Stocks have opened the month of March rip roaring again adding to the best start of the year for the averages in decades. The Dow Jones Industrial Average (see chart here) opened the trading day up over 200 points, the S&P 500 (see chart here) opened up over 20 points, the Nasdaq Composite (see chart below) opened up over 55 points and the small-cap Russell 2000 (see chart here) opened up over 11 points. These gains are adding to the double digits percentage gains the markets have already realized in 2019.

So why such a strong start to the year? I am not trying to sound like a broken record but this 10 year long bull market is a head scratcher.  No matter what has been thrown at one of the longest bull markets in history, nothing seems have an adverse affect. You name the crises and stocks shrug it off. Whether it is a geopolitical event, the Federal Reserve raising rates or the daily chaos that comes out of Washington, nothing has disrupted this incessant rise in stocks. We did get a definitive correction late last year in where the bears came out of hibernation and predicted the end of the bull market and that a 40% correction is now imminent. Well don’t look now but we are not too far off from setting new all time highs in the aforementioned indexes.

Technically speaking it appears that the coast is clear for now as well. All of the major averages are now trading above their respective 20-day, 50-day and 200 day moving averages which is a very bullish sign. The one caveat to the technical shape of the market is that stocks are a bit overextended. Overbought conditions do exist technically and according to the relative strength index also known as the RSI. That said, the pullbacks that do occur continue to be met with support with buyers stepping in willing to add to their existing positions or open up new positions. The trend remains your friend in our current environment. Good luck to all 🙂

~George

Nasdaq Composite - Paula Mahfouz

Historically A Strong Month For Stocks…

December is historically a strong month for the stock market. Many factors play into the last month of the year being a positive one including holiday bonuses, the general overall feeling of optimism and typically lighter volumes due to the holiday season. How we finish out this year will largely hinge on the results of this weekend’s G20 summit. Early indications are that the trade talks and other collaborative measures are going well. As the major averages enter into the last month of the year, The Dow Jones Industrial Average (click here for chart) finds itself at 25,538, the S&P 500 (chart) closed out the month of November at the 2,760 level, the Nasdaq Composite (chart) finished at 7,330 and the small-cap Russell 2000 (chart) finished November at 1,533. On the year, the major averages are barely in the green with the small-cap Russell 2000 actually a tad in the red.

Stocks this past week did get a boost from Federal Reserve Chairman Jerome Powell when Chairman Powell spoke at the Economic Club of New York. Chairman Powell stated that the Fed’s benchmark interest rate was now “just below” the neutral level. This sent the Dow Jones Industrial Average (see chart below) soaring over 600 points on Wednesday. Chairman Powell’s comments are being viewed by the street that the Federal Reserve just might be done raising interest rates for the foreseeable future. Now if we can get some concrete positive news and developments out of the G20 summit which is being held in Buenos Aires, then indeed we could be setting up for a year-end rally.

Let’s take a look at the moving averages technical set-up of the aforementioned key indexes starting with the Dow Jones Industrial Average (chart). At Friday’s close, the Dow is trading above its 200-day moving average by about 400 points while the S&P 500 (chart) closed right at its 200-day. Both the Nasdaq Composite (chart) and the small-cap Russell 2000 (chart) are trading below their respective 200-day moving averages but they have recently cleared and are trading above their 20-day moving averages. So technically speaking things do not look too shabby. Let’s see if we can have a rally into year-end.

Good luck to all 🙂

~George

Dow Jones Industrial Average - George Mahfouz Jr

First Half Of 2018 In The Books…

The first half of 2018 is in the books and where in the world did that go? Year to date the Dow Jones Industrial Average (chart) is off about one percent, the S&P 500 (see chart below) is up a couple of percentage points but the Nasdaq Composite (chart) and the small-cap Russell 2000 (chart) are way outperforming the other benchmark indexes closing the first half of the year up almost 10% each.

Let’s take a look how the second half of the year is shaping up. We start off the second half of the year with of course the fourth of July holiday which this year happens to be in the middle of the week. I don’t expect too much market action this upcoming week especially with a shortened trading session on Tuesday followed by the markets closing on Wednesday in recognition of the 4th of July. There could be some positioning going on both Thursday and Friday after the holiday. but all in all I am expecting lighter volume throughout the week with not too much volatility. Now the following week and the second half of the year is a whole different story. Q2 earnings reporting season will begin in earnest the week of July 9th and this my friends will be the true beginning of the second half of the trading year. I expect volatility to kick in once again as corporate America unveils their most recent quarterly results. Furthermore, we will be getting ever closer to the midterm elections that promises to be filled with about as much drama and rhetoric one can imagine. Also, historically stocks have witnessed meaningful corrections at some point during the year leading up to the midterms and I do not expect this year to be any different. I also expect corporate America to report impressive growth to their top and bottom lines; however, these results may already be priced in.

Technically speaking the aforementioned indexes all remain above their respective moving averages with the Dow Jones Industrial Average (chart) hovering right around its 200-day. Paula and I wish everyone a very safe and Happy 4th of July 🙂

~George

S&P 500 - Paula Mahfouz


The Economy Is Booming, But…

There is no question the economy is booming but what does this mean long term for stocks? When the economy is firing on all cylinders like it is now here in the United States one may think the stock market must be ready for its next leg up! Not so fast. Historically when the economy heats up and the unemployment rate becomes so low, that does not typically bode well for stocks. Why you ask? Simply put, the Federal Reserve does not want inflation to rear its head up and their main tool to avert inflationary pressures is to raise interest rates. As counterintuitive as it may seem, a strong economy and low unemployment may be the catalyst to put the brakes on this almost 10 year bull market run. That said, the major averages continue to show extraordinary resilience no matter what comes at it. The Dow Jones Industrial Average (chart) closed the week above 25,000, the S&P 500 (chart) finished the week at 2779, the Nasdaq Composite (chart), finished near its all time high and the small-cap Russell 2000 (see chart below) closed the week out a few points away from it’s all time high as well.

It is quite remarkable how the aforementioned indexes are behaving with all things considered. This past week the Federal Reserve raised interest rates again and signaled two more hikes this year and the trade war chatter and action with China and our own allies for that matter is accelerating. Just these two events alone show be putting selling pressure on stocks not setting new record highs as is the case this past week with the Nasdaq Composite (chart) and the Russell 2000 (chart). These indexes also remain well above key moving averages which at some point in time reversion to the mean should occur. I will be looking for opportunities on the short side but will continue to respect the fact that this years-long bull market remains intact at least from a technical standpoint. Good luck to all 🙂

~George

george mahfouz jr - Russell 2000


Trade War Back On!

Here we go again, the trade war is back on! Donald Trump yesterday once again fired up the trade war this time including the EU, Mexico and Canada. How is an investor supposed to confidently invest when the message and policies of our government change almost daily. Stocks all week have been whipsawed around which is great for the trader, but no so much for the investor. Now we have countries from around the world retaliating with their own tariffs on our goods. The Dow Jones Industrial Average (chart) finished the week at 24635, the S&P 500 (chart) closed the week out at 2734, the Nasdaq Composite (chart) closed at 7554 and the small-cap Russell 2000 (see chart below) showing its incredible resilience finishing the week out near an all-time high.

The chop action that we are seeing in the markets along with the unpredictably of our government gives me more reason now to focus in on the technical trading patterns of stocks and indices. Whether it is support or resistance levels vis à vis moving averages (click here) i.e. the 20-day, 50-day, 100-day, 200-day or outright overbought or oversold conditions using the Relative Strength Index (click here) or the Bollinger Bands (click here) which can also provide a technical look into extreme conditions. With Q1 earnings reporting season essentially wrapped up, there is no real apparent catalyst to move the markets in a meaningful way. Which is why I will be paying much closer attention to the technical make up of the markets to identify opportunities.

One of my favorites are the moving averages (click here) especially the 200-day moving average. For example, just take a look at the Dow Jones Industrial Average (chart) and the S&P 500 (chart). You’ll see over the past few months each time these indexes gravitated to their respective 200-day MA, they found support and proceeded higher. There is no guarantee that moving averages will always hold and provide support, but in many instances it indeed acts as a short term floor to selling pressure. There are many resources on how technical analysis can work and I would recommend studying the dynamics of TA before including it in your investment or trading strategies. Good luck to all 🙂

~George

Russell 2000 - Paula Mahfouz


Red Week For Stocks, Technicals In Play…

Stocks had a tough week pressured by the prospects of rising interest rates and political turmoil out of Washington D.C. On the week, the Dow Jones Industrial Average (see chart below) closed lower by 1.5%, the S&P 500 (chart) closed the week down 1.2%, the Nasdaq Composite (chart) finished lower by 1% and the small-cap Russell 2000 (chart) ended the week down around 1% as well. Despite a choppy and red trading week, all of the aforementioned indexes are still up on the year.

As we celebrate St. Patrick’s Day we find ourselves in a period of no real short term catalysts to steer the market in either direction other than the FOMC meeting next week. I don’t expect the Federal Reserve to surprise the markets with a larger than expected interest rate hike or change their view on interest rate policy this year. The inflation data continues to remain tame although the labor market is heating up. So what is going to drive stocks between now and Q1 earnings reporting season in April?

When we find ourselves in a period such as the one we are in, I focus in on the technical shape of the markets. And as you can see in the charts of the major averages, all of them are at their moving averages support. Whether it’s the 9 day, 20 day, 50 day, 100 or 200 day moving average, stocks and indexes typically respect and is supported by moving average support lines with the 200 day moving average being the most reliable out of all of them. This doesn’t mean that this favorite technical indicator of most market technicians is infallible, but it sure has a history of being an effective tool when navigating the markets. All things considered, including the seasonality of the markets, I do expect that these support levels should hold at least until Q1 earnings reporting season. If the moving averages don’t hold, then I would not be surprised if we revisit the early February market correction lows. Good luck to all and Paula and I wish everyone a safe and Happy St. Patricks Day 🙂

~George

Dow Jones Industrial Average - Paula Mahfouz

Finally A Tradable Market!

After years of essentially low to no volatility, traders finally get what they have been wishing for and that is a tradable market! In 2017 the markets witnessed the longest stretch of low vol in recent memory. In fact the VIX (see chart below) which is the ticker symbol for the Chicago Board Options Exchange volatility index traded in the 10 zone for most of 2017. The 10 level on the VIX (chart) is beyond abnormally low especially lasting for the better part of a year. Fast forward to today and the VIX is hovering around 20 after spiking to over 50 over the past two weeks. We haven’t seen the VIX (chart) at the 50 level in years. Call it long overdue, call it the market needed to correct, call it higher interest rates, call it what you want but finally we seemingly have more of a normal market environment. Not to say it wasn’t gut wrenching watching 1000 point Dow Jones Industrial Average (chart) intra-day swings over the past couple of weeks compared to the slow melt-up investors have enjoyed for years. Traders on the other hand have underperformed the markets during the melt-up because there simply was not enough or no volatility to be able to trade.

Stocks have indeed bounced sharply from the early February market correction. The Dow Jones Industrial Average (chart) closed the day up 307 points, the tech focused Nasdaq Composite (chart) closed up on the day 113 points, the S&P 500 (chart) closed up 32.5 points and the small-cap Russell 2000 (chart) finished the trading session up 15 points. Going forward I am certainly going to respect the technical make up of the aforementioned indexes and select stocks. Moving averages such as the 20-day, 50-day and 200-day tend to provide reliable support and resistance marks and now that we are out of the no vol environment, these moving averages tend to be more accurate and can be used to determined entries and exits in positions you hold and or trade. As I write this blog the key indexes have now rebounded to their 50-day moving averages so we will see if this technical indicator will act as resistance or if the markets can hold, breakthrough and proceed higher. Of course there is much more to consider when entering or exiting any position or strategy but when volatility comes back into the markets, most professional traders key in on the moving averages. Good luck to all 🙂

~George

VIX - Paula Mahfouz

No Fear Here…

Despite North Korea launching its seventh missile test of the year on Sunday and the White House seemingly in an upheaval, stocks continue to demonstrate no fear and continue their record setting ways. Today the S&P 500 (chart) and the Nasdaq (chart) hit all time highs. Without question this bull market is now even catching wall street veterans off guard. Q1 earnings reporting season is close to wrapping up and other than retail, most companies have reported in-line or outright beats in their earnings results, especially the tech sector. Tech has been on fire lately and this is due in large part of mega-cap tech smashing analysts expectations. Earnings results from companies such as Apple (NasdaqGS: AAPL), Amazon (NasdaqGS: AMZN), Alphabet (NasdaqGS: GOOGL) and Facebook (NasdaqGS: FB) has propelled the Nasdaq (chart) and these particular issues to all-time highs. The Dow Jones Industrial Average (chart) and the Russell 2000 (chart) remain in striking distance of setting new records as well. It is truly remarkable how the markets have been able to weather the current political environment here in the U.S. and the geopolitical risks abroad.

From a technical perspective, the aforementioned key indices are in pretty good shape. The Nasdaq (chart) is the only one of the four that remains in overbought territory according to the relative strength index. All of these averages also remain above their respective 50-day and 200-day moving averages, yet another bullish sign. Volatility also remains at historic lows. So one may ask what about the “sell in May and go away” adage? From a technical standpoint, I do not see any reason why these markets won’t continue to melt up from here. Of course there is always the risk of a geopolitical event or the actual seasonal risk of assets taking a pause or retracing a bit. That said and whatever the case may be, it is undeniable that the markets have been the most resilient in years, if ever.

Good luck to all 🙂

~George