Record Highs Continue…

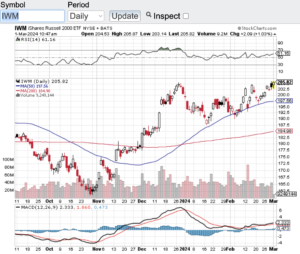
Record highs continue for the Dow Jones Industrial Average (see chart here) and for the S&P 500 (see chart here). In February, the Dow Jones Industrials hit an all-time high of 39282 while for the first time ever, the S&P 500 (see chart here) crossed the 5000 mark trading as high as 5111. These two indexes continue to demonstrate impressive strength along with the Nasdaq Composite (see chart here). It appears that the Nasdaq Composite just might join the Dow Jones Industrials and S&P 500 in hitting a fresh all-time high anytime. The small-cap Russell 2000 (see chart here & below) still has a way to go to reach its all-time high but at least this index is trending up.

Stocks aren’t the only asset class at or near all-time highs, Bitcoin has broken out as of late and has surpassed $60,000 per coin mark. The momentum continues here since Bitcoin ETFs were approved. Now this asset class in not for the faint of heart. As much as Bitcoin continues to rip, sell-offs in this asset class can be dramatic and fast.

So, what is going on with these all-time highs and the “risk on” spirit from institutional investors and retail investors alike? For one, I think the strength of the economy has something do to with this, however, I believe that rampant speculation is also play a role. Especially out of the artificial intelligence sectors as stocks there also continue to make all-time highs. My concern is how long this most recent rally has lasted. For example, the S&P 500 (see chart here) has seen gains in 15 of the last 17 weeks which is rarely seen.

With that being said, as I look at the technical shape of the aforementioned indexes, they are not in overbought territory according to the relative strength index aka the RSI. Many market technicians use this key technical indicator to gage whether a stock or index is overbought. 70 is the key value level of the RSI that would indicate an overbought condition and the major averages are trading below this mark. Now this is only one technical indicator and there are clearly many other factors that determine the state of the markets, but as of now nothing appears to be getting in the way of this impressive months long rally.

Good luck to all 🙂

~George
All Time Highs Continue - Paula Mahfouz

Record Highs For Stocks!

Record highs for stocks are hitting the tape with both the Dow Jones Industrial Average (see chart here) and the S&P 500 (see chart here) hit all time highs yesterday. The Dow Jones Industrial Average hit a high of 38,588 while the S&P 500 traded at 4931 before closing slightly lower. However, the Nasdaq Composite (see chart here) and the Russell 2000 (see chart here) did not hit their all-time highs but the uptrend in those indexes continue.

So why are two of the major averages at all-time highs? For one I think the markets have been anticipating the Federal Reserve to start cutting interest rates this year. However, Fed Chair Jerome Powell yesterday said rate cuts in the near term is not likely. Suffice to say the markets did sell off yesterday after Chair Powell’s remarks. The other factor driving stocks higher is the undeniable strength our economy and the job market. The latest Gross Domestic Product (GDP) report surprised analysts yet again. Economists were expecting the GDP to come in at an annualized growth rate of 1.5%. Instead, the economy grew on an annualized basis of 3.3%. I’d say that’s a beat! The GDP is a measure used to evaluate the strength of the economy. The GDP is the total market value of the final goods and services produced in a given country.

Going forward without question the strength of the economy and job market, along with inflation, will be guiding the Federal Reserve as to the timing of when they will begin to cut rates. Until then, the strength of companies’ earnings results, geo political factors and our own political backdrop should be the catalysts that determine where the markets trade.

Last but not least, the technical backdrop of the key indexes is in decent shape. Yes, the Dow Jones Industrial and the S&P 500 did breach the 70 RSI level briefly but has retreated some since going into overbought territory. All in all, from a technical standpoint, I do not see any alarming trends.

Good luck to all 🙂

~George


Strong Earnings – Record Highs!

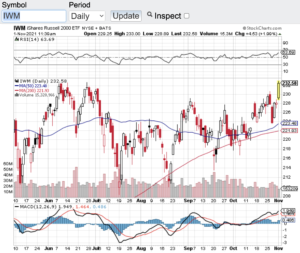
Last month I asked “Is this a healthy correction or something more?” and based on how strong earnings have been along with record highs, I think it is fair to say last months action was more of a healthy pullback than anything else. The Dow Jones Industrial Average (see chart here) is at an all-time high trading above the 36000 mark, the S&P 500 (see chart here) has also hit an all time high today, the Nasdaq Composite (see chart here) has also joined the all-time high club and the small-cap Russell 2000 (see chart here) is within striking distance of its all-time high.

The most recent catalyst for stocks and indexes hitting their all-time highs are earnings. 80 percent of the companies on the S&P 500 that have reported their Q3 earnings so far have beat Wall Street expectations. There are still 1000’s of companies set to report over the coming weeks but if trend continues we could very well be seeing more records set. Along with a strong earnings reporting season no question the Fed continues to encourage all investors to participate due to how low interest rates remain. For most investors there are not many options right now to generate meaningful returns other than the stock market or the high flying crypto space which remains incredibly volatile and extremely risky.

Now let’s take a look at the technical backdrop of the aforementioned indexes. The Dow Jones Industrial Average (see chart here) is trading comfortably above its key moving averages and not quite overbought according to the relative strength index (RSI) and the same can be said for the S&P 500 (see chart here) and the Russell 2000 (see chart below). However, the Nasdaq Composite (see chart here) has just breached the 70 value level of the RSI which is the pure definition of a stock or index becoming overbought. Note, stocks and/or indexes can remain overbought for extended periods of time before a turn.

One of the oldest adages on Wall Street is the trend is your friend and it is clear where the trend has been and where it will most likely go. That said, it is always best to consult with your certified financial planner/advisor if you are considering any portfolio additions, deletions or adjustments.

Good luck to all 🙂

~George

Strong Earnings - Record Highs - Paula Mahfouz

53 Record Highs And Counting…

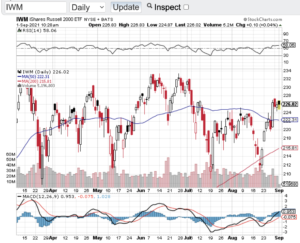
The S&P 500 (see chart here) has hit 53 record highs so far in 2021 and counting. That’s right folks 53 all-time highs this year alone. The Nasdaq Composite (see chart here) has logged 32 record highs in 2021 as well. The Dow Jones Industrial Average (see chart here) has also been on fire trading above the 35000 level and the small-cap Russell 2000 (see chart below) continues to perform alongside the aforementioned bellwether indexes. How much longer can this bull run? I think it began with the Federal Reserve and its longstanding monetary policies and now there seems to be a subtle change in the Fed’s position.

Last Friday at the Federal Reserve’s Jackson Hole Economic Symposium, Fed Reserve chairman Jerome Powell signaled again that the Fed would soon begin to pullback on its $120B per month bond asset purchases. This support to the markets and the economy along with a zero percent interest rate backdrop has been THE catalyst to support record high after record high in our stock market. Of course the massive economic stimulus packages that have been disseminated since the start of the pandemic has also played a role in consumer spending which has also propelled stocks to new heights.

Now we all know this cannot go on forever. Free money, zero percent interest rates, asset purchases and the like will end at some point in time. The question then becomes what happens to the stock market when all of this support winds down? Friends the answer is simple. Corporate America is going to have to produce on its own. Meaning this, for the continuation of this decade long bull market, companies will have to not only have to catch up with their current valuations they will have to exceed expectations going forward. This will certainly separate real growth companies from the rest of the pack and that’s when we just may see a more normal ebb and flow in our markets. Good luck to all 🙂 and have a safe and Happy Labor Day weekend.

~George

53 In a Row And Counting - Paula Mahfouz


Record Highs Again!

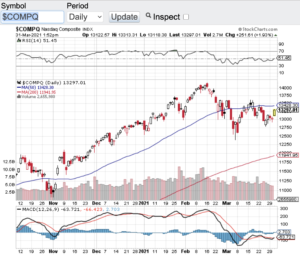
Record highs were hit again this week as both the Dow Jones Industrial Average (see chart here) and the S&P 500 (see chart here) continue to plow ahead. However, not the same can be said for the Nasdaq Composite (see chart here) and the small-cap Russell 2000 (see chart here). Both of these indexes have lagged behind the Dow and S&P torrid pace.

As with technology and small-cap stocks, when interest rates begin to move up these sectors begin to take notice. The 10-year treasury yield is one of the go to benchmarks that professional money managers key in on. This week the 10-year yield touched a one year high of 1.77% (see chart here). It’s easy to look at that yield and think that this yield is not that high at all. However, when you realize that just last summer the yield on these bills were at 1/2 of 1 percent, the move up to 1.77% does stand out. This sharp move from off the lows of 2020 is what has caught the eye of professional money managers that value high growth companies. It is clear that a full rotation out of high multiple stocks has not occurred yet, but higher interest rates and the threat of the continuation of higher interest rates seem to be the reason why the Nasdaq Composite (see chart below) and the small-cap Russell 2000 (see chart here) have lagged.

Now that the first quarter of 2021 has ended, Q1 earnings reporting season is on the horizon. I am not sure what to expect out of corporate America pertaining to top or bottom line growth. We find ourselves at what appears to be the start of coming out of the pandemic with some degree of normalcy. I would not be surprised if corporate America is bullish on their quarterly conference calls and speak directly to the early results of the vaccine deployment and the change that they are seeing in their customers behavior and spirits.

Good luck to all -)

~George

Record Highs Again! - Paula Mahfouz


$7.4 Billion In One Day!

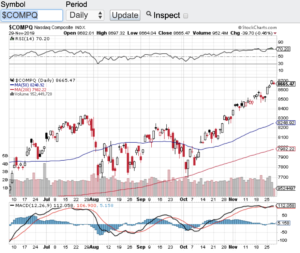
The consumer is alive and well which is evidenced by a record $7.4 billion in online sales in one day. Black Friday set a United States record for online sales and between Thanksgiving Day and Black Friday over $11 billion in online sales rang the register. Well it’s not that hard to believe when all that the stock market has done this year is set record after record. As we enter the last month of the year, the Dow Jones Industrial Average (see chart here) is trading above 28000, the S&P 500 (see chart here) starts December near an all-time high, the Nasdaq Composite (see chart below) is also near an all-time high and the small-cap Russell 2000 (see chart here) also has hit its stride breaking out above a triple top that has formed over the past few months.

I have been writing my blog for almost 10 years and I thought years one through five of the recovery from the depths of the 2008 financial crises was impressive. What’s even more impressive to me is that over the past year or so we keep setting record after record despite having one of the most unstable governments in our history. Who would have thought that with a pending impeachment, a trade war with China and tape bomb after tape bomb hitting the tape we would still be at or near record highs? Simply incredible! With that said, the Federal Reserve has done its part this year by reducing interest rates which is probably one of the main reasons the markets still remain at or near record highs.

The technical shape of the stock market appears to still be intact. Despite reaching overbought conditions last week, Friday’s pullback brought the RSI level of the aforementioned indexes back below the 70-value level. The relative strength index is a technical indicator that expresses overbought and/or oversold conditions. The 70-value level of the RSI is considered overbought while the 30-value level is considered oversold. The major indexes all traded above the 70-value level until the most recent pullback. Even if we see a meaningful pullback here in December, there are plenty of support levels that will come into play with the 20-day, 50-day, 100 and 200 day moving averages which are all below where we are trading at today and historically acts as support in sell-offs.

Good luck to all 🙂

~George

$7.4 Billion In One Day! - Paula Mahfouz

Upward Trend Remains Intact!

Record highs continue as the upward trend in the stock market remains intact! Despite the impeachment proceedings now going public and despite the China trade deal seemingly pausing we are still setting records. The Dow Jones Industrial Average (see chart here), the S&P 500 (see chart here) and the Nasdaq Composite (see chart here) all hit record highs this week. The small-cap Russell 2000 (see chart below) is holding its own in the overall upward trend, however, this index remains below its all-time high by 150 points or so.

The good news today coming out of the White House is that we are getting closer to a deal with China. This news was enough to send the Dow Jones Industrial Average (chart), the S&P 500 (chart) and the Nasdaq Composite (chart) to all time highs yet again. It is incredible that just a blurb out of the White House regarding a potential deal sends stocks rip roaring ahead. One of the concerns I have about actually seeing a deal get done by year-end is that next week it is possible a tweet from our President may read the exact opposite. If you look back and think about it how many times have we seen a tweet or an announcement that a deal is getting closer only to have the next statement speak to the exact  opposite. Hopefully today’s announcement (click here) sticks and that we actually see a trade deal get done by year-end. No more talk!

If indeed a trade deal gets done there no question this will be good for business here in the U.S. Although it may feel that stocks and the key indexes are overbought, if a deal gets done then it is very possible that we continue to notch records between now and year-end.

Good luck to all 🙂

~George

The Uptrend Remains Intact - George Mahfouz

Dow, Nasdaq And S&P All At Record Highs!

The Dow Jones Industrial Average (see chart here), the Nasdaq Composite (see chart here) and the S&P 500 (see chart here) are all at record highs. Stocks continue to be on a tear with 3 of the 4 major indexes closing at all time highs on Friday. What’s more the S&P 500 (see chart here) closed above the 3000 mark for the first time ever. The one index that still has work to do before making a new high is the small-cap Russell 2000 (see chart below). I am not exactly sure why the Russell is lagging behind the big boys but if the Russell 2000 gets going then who knows how many more records will fall.

That said, for the first time in a while the Dow Jones and the S&P 500 have both entered into overbought territory which is above the 70 value level of relative strength index also know as the RSI. The Nasdaq Composite is fast approaching overbought conditions as well. The Russell 2000 is no where near overbought. I do expect a bit of a pullback in the coming weeks which would be rather healthy for stocks after such a strong performance. I have never been a fan of buying into record highs although momentum traders would disagree. Another factor to consider is we are heading right into second quarter earnings reporting season. Earnings reporting season could be a catalyst to pause the summer rally especially with the percentage of companies issuing warnings so far (click here)

The tariffs that our administration have imposed is expected to have a negative effect on the top and bottom lines of many U.S. companies. What I will be looking for is how much of an affect these tariffs are having on corporate America. The other side of the coin is if tariffs weigh heavier than what is anticipated, this could be yet another reason for the Federal Reserve to move to cutting interest rates which is the real reason I think we are hitting all time highs. Good luck to all 🙂

~George

Russell 2000 - Paula Mahfouz


A Market Selloff That Just Did Not Happen…

As summer ended where was the market selloff? Instead of conforming to what historically are the weaker months of the year whereas stocks at the very least should of paused with lighter volumes, the major averages hit all time highs. The Dow Jones Industrial Average (chart), the S&P 500 (chart), the Nasdaq Composite (chart), the small-cap Russell 2000 (chart) and even the Dow Jones Transportation Average (see chart below) all hit record highs in the third quarter. In fact the broad based S&P 500 (chart) turned in its best quarterly performance in five years. In my previous blog, I spoke to how traders and investors alike are awaiting a September selloff but seemingly nothing can stop this perma-bull market! Not trade wars, not interest rates, not the threat of inflation, not the daily chaos out of Washington, not historic seasonality, I mean nothing has stopped this bull market. Without a doubt this has been a close your eyes and a “go long” market. If you just did that over the past decade, you would of been part of 100% plus gains and whoever did do that, congratulations!

So now begs the question of what now? What now is fourth quarter earnings reporting season and oh yes the mid-term elections! October will not only be loaded with corporate earnings reports but there is also this little event call mid-term elections. I think it is safe to say that at the very least volatility should  rear its head up. As the summer trading months were unfolding vol went back to its “low vol” standard as we have witnessed for past decade. There is just no fear in the markets. The volatility index aka the VIX (chart) is a measure of investor fear and in this case, lack thereof. I have got to believe that volatility will increase as we head into earnings reporting season and especially as we approach mid-term elections. Good luck to all! 🙂

~George

Dow Jones Transports - George Mahfouz Jr