Record Highs For Stocks!

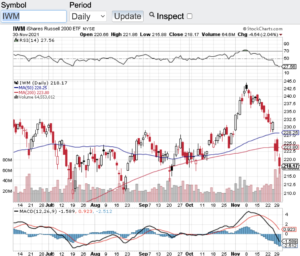
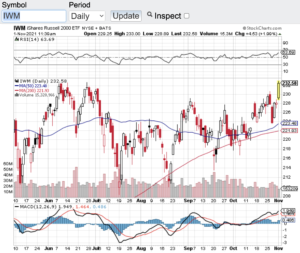
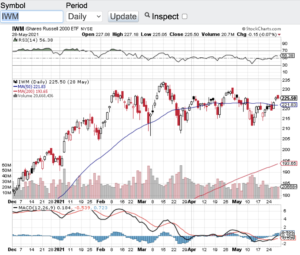
Record highs for stocks are hitting the tape with both the Dow Jones Industrial Average (see chart here) and the S&P 500 (see chart here) hit all time highs yesterday. The Dow Jones Industrial Average hit a high of 38,588 while the S&P 500 traded at 4931 before closing slightly lower. However, the Nasdaq Composite (see chart here) and the Russell 2000 (see chart here) did not hit their all-time highs but the uptrend in those indexes continue.

So why are two of the major averages at all-time highs? For one I think the markets have been anticipating the Federal Reserve to start cutting interest rates this year. However, Fed Chair Jerome Powell yesterday said rate cuts in the near term is not likely. Suffice to say the markets did sell off yesterday after Chair Powell’s remarks. The other factor driving stocks higher is the undeniable strength our economy and the job market. The latest Gross Domestic Product (GDP) report surprised analysts yet again. Economists were expecting the GDP to come in at an annualized growth rate of 1.5%. Instead, the economy grew on an annualized basis of 3.3%. I’d say that’s a beat! The GDP is a measure used to evaluate the strength of the economy. The GDP is the total market value of the final goods and services produced in a given country.

Going forward without question the strength of the economy and job market, along with inflation, will be guiding the Federal Reserve as to the timing of when they will begin to cut rates. Until then, the strength of companies’ earnings results, geo political factors and our own political backdrop should be the catalysts that determine where the markets trade.

Last but not least, the technical backdrop of the key indexes is in decent shape. Yes, the Dow Jones Industrial and the S&P 500 did breach the 70 RSI level briefly but has retreated some since going into overbought territory. All in all, from a technical standpoint, I do not see any alarming trends.

Good luck to all 🙂

~George


New Variant Spooks Markets…

A new Covid variant has spooked the markets enough to spike the VIX almost 50% (see chart here). The VIX aka the fear index took off on Friday after news out of South Africa that a new variant has emerged. The CBOE volatility index is a measure of price action in the S&P 500 options chain over the next 30 days. Investors and institutional investors alike pay attention to how investor sentiment is going at any point in time through the CBOE vol index. Historically when the markets are at work with no real headwinds or threats, the VIX in the 10-15 value range. Yesterday the VIX closed north of 27. No question over the past few days the VIX is revealing a bit of investor anxiety.

So now the question becomes is this a short-lived dynamic or is there more selling pressure in the offing? My feelings are this is a normal knee jerk reaction to yet another potential obstacle our economy and markets face. From what I have read we are weeks away to understanding the severity of this new variant or lack thereof. In the meantime, I think patience is key and to not act in haste. For all we know the vaccines could protect the population from this latest variant and if so, the markets could snap right back. However, if this becomes as severe and contagious as the Delta variant, then there is a strong chance the markets would continue to adjust accordingly.

Let’s look at the technical backdrop of the major averages starting with the Dow Jones Industrial Average (see chart here). The Dow sold off over 650 points yesterday to close just above its 200-day moving average. The S&P 500 (see chart here) closed lower by 88 points approaching its 100-day moving average. The Nasdaq Composite (see chart here) closed the month of November down 245 points while breaching its 20-day moving average. Last but not least, the small-cap Russell 2000 (see chart below) closed down sharply as well yesterday, however, technically the Russell broke its 100 and 200-day moving averages in a meaningful way which does not bode well for this particular index as we enter the last month of the year.

One final note, no matter what happens in the market here in the short term, please take care of yourselves and your loved ones. We are approaching the two-year mark of this pandemic and everyone should take this serious, put the politics and conspiracy theories away and come together once and for all.

Wishing everyone a safe and healthy holiday season 🙂

~George

New Variant Spooks Markets - Paula Mahfouz

Strong Earnings – Record Highs!

Last month I asked “Is this a healthy correction or something more?” and based on how strong earnings have been along with record highs, I think it is fair to say last months action was more of a healthy pullback than anything else. The Dow Jones Industrial Average (see chart here) is at an all-time high trading above the 36000 mark, the S&P 500 (see chart here) has also hit an all time high today, the Nasdaq Composite (see chart here) has also joined the all-time high club and the small-cap Russell 2000 (see chart here) is within striking distance of its all-time high.

The most recent catalyst for stocks and indexes hitting their all-time highs are earnings. 80 percent of the companies on the S&P 500 that have reported their Q3 earnings so far have beat Wall Street expectations. There are still 1000’s of companies set to report over the coming weeks but if trend continues we could very well be seeing more records set. Along with a strong earnings reporting season no question the Fed continues to encourage all investors to participate due to how low interest rates remain. For most investors there are not many options right now to generate meaningful returns other than the stock market or the high flying crypto space which remains incredibly volatile and extremely risky.

Now let’s take a look at the technical backdrop of the aforementioned indexes. The Dow Jones Industrial Average (see chart here) is trading comfortably above its key moving averages and not quite overbought according to the relative strength index (RSI) and the same can be said for the S&P 500 (see chart here) and the Russell 2000 (see chart below). However, the Nasdaq Composite (see chart here) has just breached the 70 value level of the RSI which is the pure definition of a stock or index becoming overbought. Note, stocks and/or indexes can remain overbought for extended periods of time before a turn.

One of the oldest adages on Wall Street is the trend is your friend and it is clear where the trend has been and where it will most likely go. That said, it is always best to consult with your certified financial planner/advisor if you are considering any portfolio additions, deletions or adjustments.

Good luck to all 🙂

~George

Strong Earnings - Record Highs - Paula Mahfouz

Risk On Remains On!

Risk on in the markets remains on as we approach the second half of the year! It’s truly remarkable to me how stocks, crypto, real estate and other asset classes are still trading at or near all time highs. I do get that the ongoing accommodative policies provided by our Federal Reserve and from central banks across the globe is the main reason why asset prices continue their bullish ways.

That said, I do think it is time to start considering how things could look once the Federal Reserve in our country starts backing away from its accommodative monetary policies and as interest rates begin to normalize. This is not a question of if, it’s a question of when. Tell tale signs of inflation are now seemingly everywhere which is what the Federal Reserve is paying close attention to and could be the catalyst for the Fed to act. It is at this point our markets could be adjusting to align with real interest rates and normalized price to earning multiples. To that end, we have and continue to witness the most unique market conditions ever seen. So I am not calling a top here and I do respect the power of the Federal Reserve, however, I am just suggesting that we may see a healthy and overdue adjustment in asset prices which may not be such a bad thing. There are many investors that are on the sidelines and would be more than happy to step in should we see asset prices adjust to a lower entry point.

Let’s take a quick look at the technical shape of the major averages. The Dow Jones Industrial Average (see chart here), the S&P 500 (see chart here), the Nasdaq Composite (see chart here) and the Small Cap Russell 2000 (see chart below) all are trading above their 20, 100 and 200 day moving averages. This alone is a strong technical backdrop and what’s more is none of the aforementioned indexes are currently overbought according to the relative strength index aka the RSI. So technically speaking things look pretty good right now.

Good luck to all 🙂

~George

Risk On Remains On - Paula Mahfouz