A Market Selloff That Just Did Not Happen…

As summer ended where was the market selloff? Instead of conforming to what historically are the weaker months of the year whereas stocks at the very least should of paused with lighter volumes, the major averages hit all time highs. The Dow Jones Industrial Average (chart), the S&P 500 (chart), the Nasdaq Composite (chart), the small-cap Russell 2000 (chart) and even the Dow Jones Transportation Average (see chart below) all hit record highs in the third quarter. In fact the broad based S&P 500 (chart) turned in its best quarterly performance in five years. In my previous blog, I spoke to how traders and investors alike are awaiting a September selloff but seemingly nothing can stop this perma-bull market! Not trade wars, not interest rates, not the threat of inflation, not the daily chaos out of Washington, not historic seasonality, I mean nothing has stopped this bull market. Without a doubt this has been a close your eyes and a “go long” market. If you just did that over the past decade, you would of been part of 100% plus gains and whoever did do that, congratulations!

So now begs the question of what now? What now is fourth quarter earnings reporting season and oh yes the mid-term elections! October will not only be loaded with corporate earnings reports but there is also this little event call mid-term elections. I think it is safe to say that at the very least volatility should  rear its head up. As the summer trading months were unfolding vol went back to its “low vol” standard as we have witnessed for past decade. There is just no fear in the markets. The volatility index aka the VIX (chart) is a measure of investor fear and in this case, lack thereof. I have got to believe that volatility will increase as we head into earnings reporting season and especially as we approach mid-term elections. Good luck to all! 🙂

~George
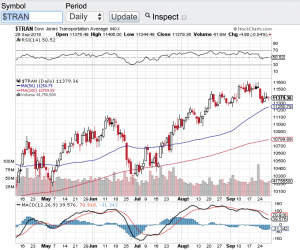
Dow Jones Transports - George Mahfouz Jr

Dow 21,000 Are You Kidding?

This market is unbelievable! As I am writing this blog the Dow Jones Industrial Average (chart) has eclipsed the 21,000 mark. This after President Donald Trump’s first speech to the joint session of Congress. Not only has the Dow breached 21,000, the Nasdaq (chart) has also set a new record this morning at 5,875, the S&P 500 (chart) has set a new record of 2,384 and counting, the small-cap Russell 2000 (chart) has hit a new record high and even the Dow Jones Transportation Average (chart) has set a new record high this morning at 9567.

It’s been exactly one month since the Dow Jones Industrial Average (chart) topped the 20,000 mark and now catapulting through 21,000! It’s inconceivable that the Dow has tacked on yet another 1,000 points in a month. The bears must be in shock! I am not exactly sure what President Trump said last night that is any different from what he has already promised during his campaign and during his inaugural speech in January. One would think that the markets have already priced in the “huge” corporate tax cuts Trump has promised. Also, I thought that the markets have also priced in the proposed $1 trillion dollar infrastructure spend. One thing for sure, right now the markets don’t care about valuations or the fact that it will take time for the Trump administration to figure out if the tax cuts or infrastructure spend as promised will even occur as designed?

I like to close my blogs out with the current technical take of the indexes. Quite honestly, the technicians are also baffled about this tape. The Dow Jones Industrial Average (chart) remains in extremely overbought conditions as does the S&P 500 (chart). The Nasdaq (chart) just re-entered overbought territory according to the relative strength index and the small-cap Russell 2000 (chart) is heading in that direction. We are witnessing one of the strongest bull markets in history!

Good luck to all 🙂

~George


Nine in a row!

The Dow Jones Industrial Average (chart) closed at a record high notching its ninth day in a row of gains. A streak not seen since 1996. Furthermore, the small-cap Russell 2000 (chart) and the Dow Jones Transportation Average (chart) also closed at record highs. The S&P 500 (chart) is also a hiccup away from a record. The momentum and year-to-date gains in these markets are breathtaking, especially when you consider all of the potential headline risks here and abroad.

As a trader or investor it’s incredibly tempting and seemingly logical to commence a short position thesis right now as everyday a new record is being set. However, picking a top or getting in the way of this parabolic move can be painful and costly. Also, it is very difficult to initiate new long positions when everyone on the street knows at some point and time a pullback in equities will occur.

So what’s a trader do in this market environment? Personally, I look for individual names that may be experiencing a “one time” event which may create a buying or selling opportunity. For example let’s take a look at Spectrum Pharmaceuticals, Inc. (NasdaqGS: SPPI). Here is a company that lost over 37% of its value today and traded over 22,000,000 shares which represents almost half of its float. The plunge in the company’s shares were due to an unexpected forecast by the company indicating their full year revenue will decline dramatically over its core drug Fusilev. This news definitely caught the street off guard especially after the company had expected sales to rise this year.

So when I see a haircut such as the one Spectrum received today, I immediately look to the fundamentals to see if this is an over reaction, or if there is more downward pressure ahead. After taking a gander at the fundies, the one thing that stood out to me was the significant short interest in the stock. According to nasdaq.com, as of February 28th the short interest in Spectrum stood at a whopping 27,231,552 shares. This is almost 50% of the entire outstanding shares held short. Now who knows how much of the short position has covered since February 28th, or how many shares remain short? Of course, this is not the only metric I look at when considering taking action, but this particular metric most certainly stood out to me. What I have seen in the past with other scenario’s such as this, with such a large short position, and after a major sell-off such as the one Spectrum experienced today, at the very bare minimum some type of short covering rally typically ensues.

By no means am I suggesting to go long or short Spectrum or any other asset or index, what I am doing is highlighting the fact that in any macro-market environment whether its overbought or oversold, if you do your research and subsequent due diligence, there can be opportunities found long or short. That said, it is always best and in this environment required to consult a certified financial professional before considering any investment or investment strategy.

Have a good evening.

~George