Earnings And The Fed!

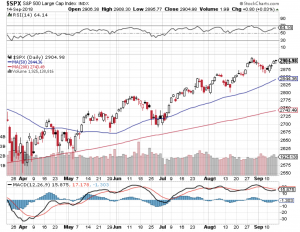
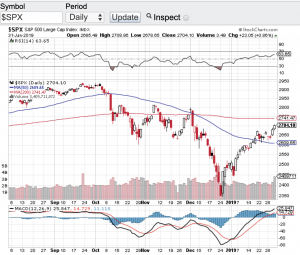
Stocks took off this week and we can blame earnings and the Fed! Now that we are fully into earnings reporting season the investors so far have liked what they see. Couple that with the Federal Reserve coming out on Wednesday stating that the central bank is “changing its tune” on interest rates, and you have a one-two bull market punch. Also on Wednesday, Fed Chairman Powell stated “the case for raising rates has weakened somewhat” and that the Federal Reserve will be more patient toward further rate hikes. Stocks rallied hard on the Fed’s new position along with stronger than expected earnings reports that are coming in from corporate America. For the month of January, The Dow Jones Industrial Average (see chart here) is up over 2000 points, the S&P 500 (see chart below) is also up over 200 points, the Nasdaq Composite (see chart here) is up 800 points and the small-cap Russell 2000 (see chart here) closed out the month of January up 175 points. January 2019 has been one of the best performing months in years.

Let’s take a look at the technical shape of the markets from a moving averages perspective. The Dow Jones Industrial Average (chart) has just broken through its 200-day moving average, while the S&P 500 (chart) and the Nasdaq Composite (chart) are both sitting on its 100-day moving average and the small-cap Russell 2000 (chart)is not too far behind. There are still plenty of earnings reports that will be released over the next few weeks and to me this is the remaining catalyst that could drive stocks higher here in the short term. Let’s keep in mind there are still other catalysts on the horizon that could put the brakes on this most recent rally with the government having yet another deadline to reach a deal on border security and of course the looming tariff deal with China. If one or both of these deals do not get done, I think we will be having a different conversation in March. Until then, let’s enjoy the current wave of positive news and market action and then see what kind of adjustments that would possibly need to be made. Good luck to all 🙂

~George
S & P 500 - Paula Mahfouz


Traders And Investors Are Awaiting A September Selloff…

Traders and investors are awaiting a September selloff that actually may not come. Stocks continue to demonstrate strength and resiliency despite the political turmoil in Washington DC, rising interest rates and a seasonality headwind that just isn’t happening. August and September are typically weaker months for the stock market, instead the S&P 500 (see chart below), the Nasdaq Composite (chart) and the small-cap Russell 2000 (chart) hit all-time record highs and the end of August and despite a mini pullback shortly thereafter, the markets appear to have stabilized near all time highs. The Dow Jones Industrial Average (chart) did not make an all-time high in August, however, this index remains within striking distance of its all time high. The pundits are speaking to the strength of corporate America where earnings and profits are at their highest levels in decades as to the reason why the markets are not selling off. What is undeniable is that any time stocks have experienced a pull back it has been met with support from institutional investors and retail investors alike.

Speaking of support, let’s take a closer look at the technical shape of the aforementioned key indexes. Let’s start with the S&P 500 (chart). After pulling back to its 20-day moving average the S&P is right back at a breakout point. Next week we should see if the S&P can indeed breakout or fail and head back to its 20-day. The Nasdaq Composite index (chart) has similar chart pattern although it traded a bit below its 20-day support line for a few days before recapturing its 20-day and is now trading above it. A look at the Russell 2000 (chart), it too closed above its 20-day moving average and last but not least the Dow Jones Industrial Average (chart) also closed above its 20-day and this index is also right at a breakout or breakdown point. These bellwether indexes are also not in an extreme overbought condition according to the Relative Strength Index. The RSI tracks overbought or oversold conditions and is a momentum indicator that measures the degree and velocity of recent price changes to determine what is overbought and what may be oversold. We are simply not in any extreme condition according to the RSI principle.

Let’s see how the back half of September plays out and we will revisit the technical set-up of the markets in October. Good luck to all 🙂

~George

S&P 500 - George Mahfouz Jr


Finally A Tradable Market!

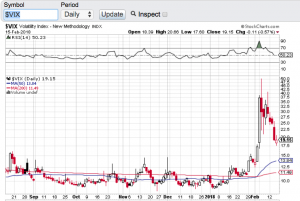
After years of essentially low to no volatility, traders finally get what they have been wishing for and that is a tradable market! In 2017 the markets witnessed the longest stretch of low vol in recent memory. In fact the VIX (see chart below) which is the ticker symbol for the Chicago Board Options Exchange volatility index traded in the 10 zone for most of 2017. The 10 level on the VIX (chart) is beyond abnormally low especially lasting for the better part of a year. Fast forward to today and the VIX is hovering around 20 after spiking to over 50 over the past two weeks. We haven’t seen the VIX (chart) at the 50 level in years. Call it long overdue, call it the market needed to correct, call it higher interest rates, call it what you want but finally we seemingly have more of a normal market environment. Not to say it wasn’t gut wrenching watching 1000 point Dow Jones Industrial Average (chart) intra-day swings over the past couple of weeks compared to the slow melt-up investors have enjoyed for years. Traders on the other hand have underperformed the markets during the melt-up because there simply was not enough or no volatility to be able to trade.

Stocks have indeed bounced sharply from the early February market correction. The Dow Jones Industrial Average (chart) closed the day up 307 points, the tech focused Nasdaq Composite (chart) closed up on the day 113 points, the S&P 500 (chart) closed up 32.5 points and the small-cap Russell 2000 (chart) finished the trading session up 15 points. Going forward I am certainly going to respect the technical make up of the aforementioned indexes and select stocks. Moving averages such as the 20-day, 50-day and 200-day tend to provide reliable support and resistance marks and now that we are out of the no vol environment, these moving averages tend to be more accurate and can be used to determined entries and exits in positions you hold and or trade. As I write this blog the key indexes have now rebounded to their 50-day moving averages so we will see if this technical indicator will act as resistance or if the markets can hold, breakthrough and proceed higher. Of course there is much more to consider when entering or exiting any position or strategy but when volatility comes back into the markets, most professional traders key in on the moving averages. Good luck to all 🙂

~George

VIX - Paula Mahfouz

Dow 22,000 In Sight…

The Dow Jones Industrial Average (chart) closed the month of July at a record high and came within 70 points of the 22,000 mark. Just a few short months ago that the Dow surpassed the 21,000 milestone. What an incredible run in such a short period of time! Not only is the Dow Jones Industrial Average (chart) notching new record highs almost daily, the Nasdaq (chart) last Thursday posted a new record at 6460, as did the S&P 500 (chart) setting a new record of 2484. Last but not least, the small-cap Russell 2000 (chart) also set a new record last week of 1452. However, both the Nasdaq (chart) and the small-cap Russell 2000 (chart) have reversed their upward trajectory over the last few trading sessions in a noticeable manner. Let’s keep an eye on this development.

I think it is safe to say that Q2 earnings reporting season has helped fuel the Dow Jones to new record highs as well as the S&P 500. Tech stocks have been reporting a mixed bag so far this earnings reporting season which is why that index has started to abate a bit. All eyes today are on Apple (NasdaqGS: AAPL) which report their earnings results after the close. This could be the one stock that either reverses the latest mini-downward trend in the Nasdaq or for that matter, accelerate it. As I look to the technical shape of the the aforementioned indexes, only the Dow Jones Industrial Average (chart) is on overbought territory, while the S&P 500 (chart), Nasdaq (chart) and the small-cap Russell 2000 (chart) have begun their reversion to the mean and are all approaching the 50 value level of the relative strength index.

Game plan for August? Personally, I think it is time to reduce long exposure to equities due in part to this startling run stocks have had all year long. This coupled with the month of August being an historically weak month for equities could create the perfect set up for the much anticipated market correction that the bears have been waiting on. That said, I have to remind myself that there has been no such thing as typical in these markets for we have been in unchartered territory for a long period of time. One final note, it is always recommended to consult with a certified financial planner before making any adjustments to your portfolio.

Good luck to all 🙂

~George


Are Energy Stocks And Banks Cracking?

As technology stocks continue to tick up to new record highs, banks and even more so energy stocks are showing signs of weakness. Yesterday, the Nasdaq (chart) hit an all time high of 6221.99 and the S&P 500 (chart) also notched a record recently at 2418.71. That said, the energy sector has lost almost 10 percent in the last month or so and the banking sector is beginning to technically breakdown. A very noticeable divergence is happening here and I think it is time to pay attention to this recent dynamic. The Dow Jones Industrial Average (chart) remains above 21000 and the small-cap Russell 2000 (chart) is seeking direction.

I am not surprised that certain sectors of the market are showing weakness which is only normal with the tremendous run the markets have had since the election, however, it is the sectors that are breaking down that is a bit alarming to me. One has to ask is the price action in oil and energy stocks indicative of weakening demand hence a weakening economy? Or is this just a matter of too much supply in oil regardless of the O.P.E.C. commitment to its production cuts. As far as the banks are concerned, one would also think with the Federal Reserve raising interest rates at their upcoming meeting in June and committing to additional rate hikes this year. that this would be bullish for bank stocks. Not the case recently. I am a little perplexed to the way the tape has been acting as of late especially pertaining to the aforementioned sectors.

The technical shape of the key indices appear to be intact with the exception of the small-cap Russell 2000. The Dow Jones Industrial Average (chart) is trading well above its 50-day moving average, along with the S&P 500 (chart)  trading near all-time highs and the Nasdaq (chart) as mentioned above hit an all-time high yesterday. However, the small-cap Russell 2000 (chart) is trading below its 50-day moving average and has been challenging certain support zones lately. This is yet another potential alarm along with the energy and banking sector weakness lately. So I would not be surprised to see the selling pressure in these particular sectors continue in the month of June which is historically one of the weakest month of the year for stocks. Good luck to all 🙂

~George

No Fear Here…

Despite North Korea launching its seventh missile test of the year on Sunday and the White House seemingly in an upheaval, stocks continue to demonstrate no fear and continue their record setting ways. Today the S&P 500 (chart) and the Nasdaq (chart) hit all time highs. Without question this bull market is now even catching wall street veterans off guard. Q1 earnings reporting season is close to wrapping up and other than retail, most companies have reported in-line or outright beats in their earnings results, especially the tech sector. Tech has been on fire lately and this is due in large part of mega-cap tech smashing analysts expectations. Earnings results from companies such as Apple (NasdaqGS: AAPL), Amazon (NasdaqGS: AMZN), Alphabet (NasdaqGS: GOOGL) and Facebook (NasdaqGS: FB) has propelled the Nasdaq (chart) and these particular issues to all-time highs. The Dow Jones Industrial Average (chart) and the Russell 2000 (chart) remain in striking distance of setting new records as well. It is truly remarkable how the markets have been able to weather the current political environment here in the U.S. and the geopolitical risks abroad.

From a technical perspective, the aforementioned key indices are in pretty good shape. The Nasdaq (chart) is the only one of the four that remains in overbought territory according to the relative strength index. All of these averages also remain above their respective 50-day and 200-day moving averages, yet another bullish sign. Volatility also remains at historic lows. So one may ask what about the “sell in May and go away” adage? From a technical standpoint, I do not see any reason why these markets won’t continue to melt up from here. Of course there is always the risk of a geopolitical event or the actual seasonal risk of assets taking a pause or retracing a bit. That said and whatever the case may be, it is undeniable that the markets have been the most resilient in years, if ever.

Good luck to all 🙂

~George

Record Setting Week!

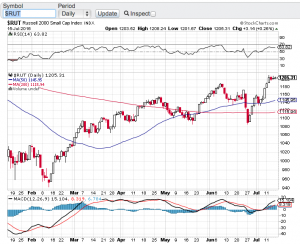
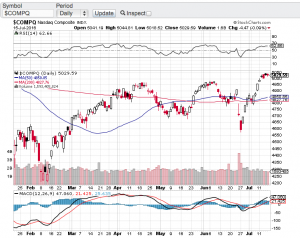
A three-week stock market winning streak has propelled the Dow Jones Industrial Average (chart) and the S&P 500 (chart) to close at record highs. In one of the most dramatic turn of events from the shocking Brexit vote to today, these key indices were breaking records all week long. The Nasdaq (see chart below) and the small-cap Russell 2000 (see chart below) also posted a strong week of gains.

I stand corrected! In my previous blog I referred to the fact that the S&P 500 (chart) had been stuck in a trading range and that upcoming earnings reporting season should act as the catalyst to break stocks out of this range. Furthermore, my view was that corporate earnings most likely would underperform hence a breakdown out of this trading would be more probable. Well here we are today at record highs and we haven’t even gotten into the bulk of earnings reporting season. The largest U.S. bank J.P. Morgan (NYSE: JPM) did however report their results this past week posting a profit of $6.2B. J.P. Morgan’s results came in stronger than expected which also helped fuel this week’s rally, especially in the banking sector.

As much as we were oversold leading up to and just after the Brexit vote, the markets now find themselves approaching overbought territory. Now the question becomes what to do next? As mentioned above, we are full steam ahead into the bulk of earnings reporting season which can come with plenty of surprises. From a technical standpoint I find it hard to commit any new capital into a market at record highs and do so with most of corporate America yet to report their results. I will be paying attention to the top-line growth of companies to get more of an accurate read how their business is fairing compared to their bottom line which can be adjusted in many ways that may not tell the whole story. My concern now is how can record highs continue if top-line growth is not there in a meaningful way? Let’s look to next week to see if the record setting trend continues, or a pause and reversal comes forward.

Good luck to all 🙂

~George

George Mahfouz Jr. Russell 2000 chart

george mahfouz jr Nasdaq chart

Volatility Wakes Up!

After weeks of tepid volatility (chart)  investors and markets appear a bit jittery with volatility waking up. For the week, the Dow Jones Industrial Average (chart) closed down 1.3%, the tech-focused Nasdaq (chart) closed off 2.7%, the S&P 500 (chart) closed lower by 1.3% and the small-cap Russell 2000 (chart) finished lower on the week by 1.4%. As first quarter earnings reporting season begins to wind down with overall results coming in mixed, we now enter a time of year where weakness in stocks can occur with volatility even more prevalent. The old adage “sell in May and go away” could come into play.

The currents risks to the market as I see it is the market itself as valuations are historically high with the S&P 500 price to earnings ratio trading in the 20’s. Another risk to stocks is the possibility of the Fed raising rates in June.  These catalysts alone could be all that it takes for equities to not only pause but to continue to experience increased volatility as we head into the summer months. So now let’s look at the technical shape of the aforementioned indexes. After trading near or in overbought territory for the past month or so the Dow Jones Industrial Average (chart) broke through its 20-day moving average, the S&P 500 (chart) also broke through its 20-day moving average, however, a bit more troublesome is the Nasdaq (chart)  as it has broke through its 200-day moving average this past week, a moving average that is more closely watched. Finally, the small-cap Russell 2000 (chart) is now sitting right at its 20-day and 200-day moving averages. So the technical shape of the markets at least according to moving averages support lines appear to be breaking down a bit.

So as we head into a typically softer time for equities that is May and June, and considering the current technical shape of the markets, both Paula and I feel it would be best to move to the sidelines and see if the current increase in volatility continues or if this is just a pause in the sharp rally we have seen since the middle of February.

Good luck to all 🙂

~George

Happy New Year!

2015 essentially proved to be a flat to down year for stocks taking some investors and traders by surprise. The Dow Jones Industrial Average (chart) closed the year down 2.2%, the S&P 500 (chart) minus dividends closed down just under 1%, the Nasdaq (chart) closed up 5.73% and the small-cap Russell 2000 (chart) closed the year down 5.71%. What’s more is how crude oil (chart) fared in 2015 declining more than 30% which also had weighed heavily on the aforementioned indices.

Looking ahead to this year, stocks find themselves in a place where they haven’t been in quite sometime and that is a rising interest rate environment. Historically speaking, equities tend to be under pressure at the beginning of and throughout a rate hike cycle with the exception of cyclical stocks and certain commodities. However this time may be different. In the past when the Federal Reserve begins to raise interest rates it is usually to fend off inflation and/or to cool off the economy when it becomes too hot. From my view and from the data flow, this is not the environment we find ourselves in today. So I do not expect that the Federal Reserve would raise rates aggressively or too quickly. With that said, the markets might not trade the way they would if we were in an inflationary environment with rising interest rates. Nonetheless, I do think that more volatility will come into stocks in 2016 and it will become more of a stock pickers market.

Furthermore, the technical shape of the market appears to be setting up for more downward movement as the key indexes have breached or are about to breach their respective 200-day moving averages. However, it would take days of trading below their 200-day to set off an alarm at least from a technical perspective. Let’s see how the first week of trading in the new year plays out before making any sort of definitive technical opinion.

Both Paula and I sincerely wish everyone the healthiest, happiest, safest and most prosperus New Year yet 🙂

~George

Stocks Go On A Bumpy Ride…

The stock market ended the week eking out slight gains. For the week, the Dow Jones Industrial Average (chart) closed higher by 0.6%, the Nasdaq (chart) barely closed in the green on the week, the S&P 500 (chart) closed up 0.7% and the small-cap Russell 2000 (chart) finished the week up one half of one percent. I guess this could be viewed as a big win for the key indices considering how light crude oil (chart) has plummeted recently which directly correlates to the energy industry as a whole. Energy stocks have also gotten crushed along with oil which is why I think it’s rather impressive that aforementioned indexes were able to end the week in positive territory. However, volatility (chart) is continuing to spike and the 200-day moving average on the S&P 500 (chart) continues to get challenged. Some pundits believe that it’s only a matter of time that the 200-day on the S&P (chart) will not hold much longer, however, if you look back, no one can deny how this technical metric has been a pillar of support for this most watched index.

So what does an investor or trader do in this historically weak month for stocks and with volatility spiking now weekly? For me personally, I am not as active in the markets due the volatility spikes and typically lower volumes associated with the summer month of August. I prefer to spend my time in research identifying opportunities in the marketplace. For instance, watching the oil markets unravel the way that they have, without question opportunities are forthcoming in this space. The majority of individual energy stocks do indeed trade with the price of oil (chart) and to predict when the price of oil will stabilize is almost impossible. However, at some point in time oil will indeed stabilize and a plethora of opportunity will surface. If you do not want to take the risk on individual names, you can always consider the most popular ETF that tracks the energy space (symbol: XLE). This equity energy fund has an approximate $11.69 billion in net assets with holdings in some of the largest and most respected energy companies in the world. Of course and as I always recommend, it is always best practice to consult with a certified financial planner(s) that you feel comfortable and confident with before making any investment decisions. Good luck to all 🙂

~George