Record Highs Again!

Record highs were hit again this week as both the Dow Jones Industrial Average (see chart here) and the S&P 500 (see chart here) continue to plow ahead. However, not the same can be said for the Nasdaq Composite (see chart here) and the small-cap Russell 2000 (see chart here). Both of these indexes have lagged behind the Dow and S&P torrid pace.

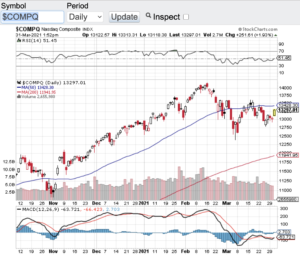
As with technology and small-cap stocks, when interest rates begin to move up these sectors begin to take notice. The 10-year treasury yield is one of the go to benchmarks that professional money managers key in on. This week the 10-year yield touched a one year high of 1.77% (see chart here). It’s easy to look at that yield and think that this yield is not that high at all. However, when you realize that just last summer the yield on these bills were at 1/2 of 1 percent, the move up to 1.77% does stand out. This sharp move from off the lows of 2020 is what has caught the eye of professional money managers that value high growth companies. It is clear that a full rotation out of high multiple stocks has not occurred yet, but higher interest rates and the threat of the continuation of higher interest rates seem to be the reason why the Nasdaq Composite (see chart below) and the small-cap Russell 2000 (see chart here) have lagged.

Now that the first quarter of 2021 has ended, Q1 earnings reporting season is on the horizon. I am not sure what to expect out of corporate America pertaining to top or bottom line growth. We find ourselves at what appears to be the start of coming out of the pandemic with some degree of normalcy. I would not be surprised if corporate America is bullish on their quarterly conference calls and speak directly to the early results of the vaccine deployment and the change that they are seeing in their customers behavior and spirits.

Good luck to all -)

~George

Record Highs Again! - Paula Mahfouz


Are Energy Stocks And Banks Cracking?

As technology stocks continue to tick up to new record highs, banks and even more so energy stocks are showing signs of weakness. Yesterday, the Nasdaq (chart) hit an all time high of 6221.99 and the S&P 500 (chart) also notched a record recently at 2418.71. That said, the energy sector has lost almost 10 percent in the last month or so and the banking sector is beginning to technically breakdown. A very noticeable divergence is happening here and I think it is time to pay attention to this recent dynamic. The Dow Jones Industrial Average (chart) remains above 21000 and the small-cap Russell 2000 (chart) is seeking direction.

I am not surprised that certain sectors of the market are showing weakness which is only normal with the tremendous run the markets have had since the election, however, it is the sectors that are breaking down that is a bit alarming to me. One has to ask is the price action in oil and energy stocks indicative of weakening demand hence a weakening economy? Or is this just a matter of too much supply in oil regardless of the O.P.E.C. commitment to its production cuts. As far as the banks are concerned, one would also think with the Federal Reserve raising interest rates at their upcoming meeting in June and committing to additional rate hikes this year. that this would be bullish for bank stocks. Not the case recently. I am a little perplexed to the way the tape has been acting as of late especially pertaining to the aforementioned sectors.

The technical shape of the key indices appear to be intact with the exception of the small-cap Russell 2000. The Dow Jones Industrial Average (chart) is trading well above its 50-day moving average, along with the S&P 500 (chart)  trading near all-time highs and the Nasdaq (chart) as mentioned above hit an all-time high yesterday. However, the small-cap Russell 2000 (chart) is trading below its 50-day moving average and has been challenging certain support zones lately. This is yet another potential alarm along with the energy and banking sector weakness lately. So I would not be surprised to see the selling pressure in these particular sectors continue in the month of June which is historically one of the weakest month of the year for stocks. Good luck to all 🙂

~George

Happy New Year!

If 2014 comes anywhere near the performance the overall markets experienced last year, once again the bulls will be popping champagne. For the year 2013, the Dow Jones Industrial Average (chart) closed up a breathtaking 26.5%, the Nasdaq (chart) finished the year up a staggering 38%, the S&P 500 (chart) booked a spectacular gain of almost 30% and the small-cap Russell 2000 (chart) soared 37%. I think it’s safe to say that an exact repeat of 2013’s performance is highly unlikely, but there is seemingly no reason to believe that this momentum won’t continue into the new year. Even the key indices in Europe had very impressive double digit gains in 2013 with the German DAX index leading the way surging 26% on the year.

With that said, the first thing that pops out to me is that the aforementioned key indices are all now near or completely in overbought territory according to the Relative Strength Index (RSI) technical indicator. We have been monitoring these indexes since October of 2013 to see when they may go into extreme overbought conditions and with the powerful year end close, we now have 3 of the 4 key indexes officially in overbought territory with the Russell 2000 (chart) only a few value points to go. So what does this all mean for the investor or even more so, to the trader? By now all of you know that I personally view the RSI as a reliable technical indicator distinguishing whether an index or stock for that matter is overbought or oversold. In fact, certain computer algorithmic trading models are designed to act whenever extreme conditions occur in a given market or stock. Let’s recap the definition of the Relative Strength Index or the RSI. In the most simplest terms, the RSI is designed to demonstrate whether or not an index or equity is overbought or oversold, depending on certain value levels. According to the RSI principle, the 70 value level or greater, is an overbought condition and the 30 value and below is an oversold condition. And as mentioned the majority of the key indices along with dozens of stocks are now in overbought territory. This doesn’t mean that we will all of a sudden see a dramatic turn in the opposite direction, however, typically when stocks or indexes are in overbought or oversold conditions such as they are now, at some point in time, a change of direction ensues.

The wild card that will most certainly continue to play out is of course the Federal Reserve and what course of action they will take and uphold in 2014. Especially now that the Fed has started to reduce its asset purchases. We all know that the accommodative policies of the Fed over the past few years has placed a floor under these markets and whenever any attempt of a pullback or mini-correction has occurred, that condition has been met with unprecedented support, hence new market highs followed. I would expect as long as the Fed continues to support the bond and mortgage backed securities markets, even at a reduced rate, whatever pullbacks or retracements that do occur, buyers will be anxiously awaiting to add to their positions or open new ones.

I do expect a healthy 5%, 10% or even 15% correction in 2014 and if you have the gumption to go short, this could serve you well. Of course no one knows if or when this correction may take place, however, as highlighted, we are now in overbought territory which could be one of the catalysts to prompt a pullback or even a subtle correction. Should we get this healthy correction, we will be looking into the financial and technology sectors to identify opportunities to capitalize on. Please note this is not a recommendation to go short or long any asset or index, and it is prudent to consult with a certified financial planner(s) before making any investment decisions.

Good luck to all and both Paula and I wish everyone a very safe, prosperous and Happy New Year 🙂

~George