On And Off, And Then On Again…
The tariffs are on then off, and then on again and the markets are swinging to every move that is being made. As mentioned in my last blog, for those traders who love volatility this is your market! For those who are long-term investors, yes, a little nerve wracking, but opportunities are also provided in the current backdrop we are in.
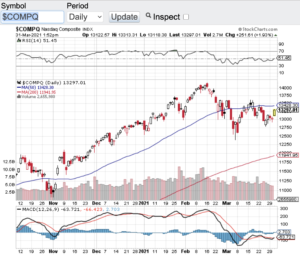
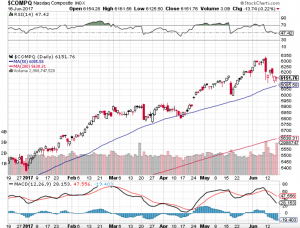
For all of the volatility we have witnessed over the past months, The Dow Jones Industrial Average (see chart here) managed to close the month of May up 1600 points, the S&P 500 (see chart here) closed out the month up 342 points, the Nasdaq Composite (see chart here) closed up 1667 points while the small-cap Russell 2000 (see chart here) finished on a positive note as well closing out the month of May up 102 points.
So how do we plan ahead and what’s in store for the summer months? I think we will see pretty much the same market activity. I expect market volatility to continue not only with the constant flow of tariff news, but also and even more so the future economic news. We have yet to see the effects of how these tariffs are playing a role in our economy. Lately there has been news out of the top companies in America that prices that consumers pay will be going up due to these tariffs. To me this is no surprise, who else would pay for them? I understand that Washington is coming out and saying that we are in negotiations with all countries that are getting hit with our tariffs, a strategy that can indeed work. Let’s hope so this way we all can start measuring the value of the markets in a traditional sense.
As I look at the technical shape of the indexes, we are currently not in an overbought or oversold condition. This according to the relative strength index aka the RSI. Let’s see how this week fares as the markets are trying to pick a direction. Good luck to all 🙂
~George