Record After Record!

The U.S. stock market notched record after record in 2021! What a year for all asset classes from stocks, to real estate, to the crypto markets!

The Dow Jones Industrial Average (see chart here) finished 2021 up 18.7%. The S&P 500 (see chart here) closed the year out up a whopping 27%. The Nasdaq Composite (see chart here) closed up 21.5% and the small-cap Russell 2000 (see chart here) closed 2021 up 13.7%. How counterintuitive are these results as our country and the world for that matter continues to face and deal with Covid-19. Covid is now entering its 3rd year with the latest variant taking the world by storm. The omicron variant are causing infection rates to soar. However, scientists are hopeful that this variant could be the catalyst to ending this pandemic due to how less virulent this variant is at least to the fully vaccinated. It’s still early but the way omicron has now seemingly and abruptly reversed its course in South Africa, there is hope that this will be the case everywhere else.

Back to the markets. As we enter 2022 the big question and maybe the only question the markets have is how aggressive will the Federal Reserve be in hiking interest rates. No question in the new year interest rates will begin to head north. Inflation is soaring and impacting almost everything, which is part of the reason why we are seeing all-time highs across the board. This is not sustainable and with interest rates on the verge of increasing, stocks will face their first true test as the tightening rolls out. That said and because the pandemic is still wreaking havoc, I do not expect the Fed will be too aggressive out of the gate.

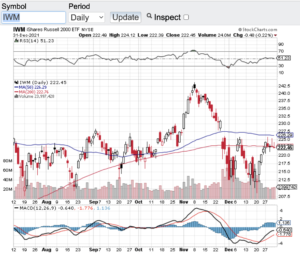
Let’s look at the technical shape of the aforementioned indexes. The Dow Jones Industrial Average (see chart here) is comfortably trading above its 100 and 200-day moving averages as is the S&P 500 (see chart here) and the Nasdaq Composite (see chart here). The small-cap Russell 2000 (see chart below) is trading at it 100 and 200 day MA so let’s see if these support lines hold for the Russell. The other technical indicator that I prefer is the relative strength index aka the RSI and none of the aforementioned indexes are in overbought territory according to the RSI. The 70 value level of the RSI is considered overbought and the 30 value level is considered oversold and each index is trading right around the middle of that range.

Happy New Year!

~George
Record After Record! - Paula Mahfouz


Is That It?

After what appeared to be the beginning of a healthy correction in the early part of August, stocks held true to form and rallied back this week even as Ukrainian forces engaged and attacked a Russian armored convoy today. When news leaked about the attack, the markets did reverse their earlier gains and dropped meaningfully only to find support and rebound off sessions lows. The Nasdaq (chart) actually finished the day in the green. If you are long this market and are bullish for the remainder of the year, you have got to feel pretty good about how the markets have responded this week to a very unstable geopolitical global environment. For the week, the Dow Jones Industrial Average (chart) gained 0.66%, the Nasdaq (chart) finished the week up 2.15%, the S&P 500 (chart) +1.215% and the small-cap Russell 2000 (chart) closed the week up 0.91%.

Does this mean we are out of the woods yet? I am not so sure. One thing that I believe will continue is market volatility. There is headline risk and equities are certainly reacting to sudden headlines that come out of Ukraine as well as the middle east. The surprise I think is how resilient the U.S. stock market remains in the midst of the geopolitical risks that are upon us. However, this is the one thing that continues to concern me is the escalation of conflict in not just one region but now in two. One way to insure a portfolio is to buy some protection in the form of S&P 500 puts, and more specifically puts on one the most popular ETF that tracks the S&P 500, the SPDR S&P 500 (NYSE: SPY) (chart). So if you have a long portfolio in equities, by buying put protection with the SPY’s, it is like buying an insurance policy should the equity market experience a correction. Put options go up in value should the equity or index you buy puts in goes down in value. Options are not for everyone and it is usually wise to consult with a certified financial planner(s) before implementing any investment strategy, I am just illustrating one way to protect a long portfolio by way of insuring it to a certain degree.

As far as I am concerned, I will continue to monitor the technical conditions of the aforementioned indexes and look for any signs of overbought or oversold conditions to act upon. As of right now the key indices are not in either condition. Good luck to all 🙂

Have a great weekend.

~George