Red Week For Stocks, Technicals In Play…

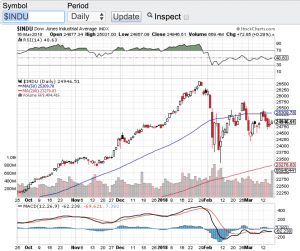
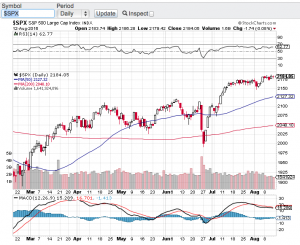
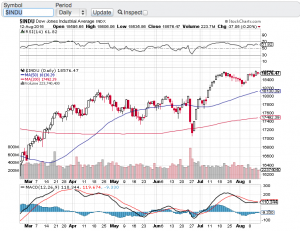
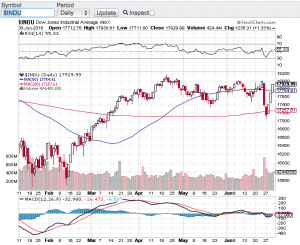
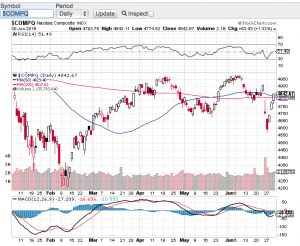
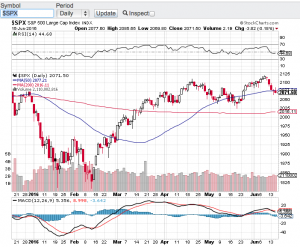
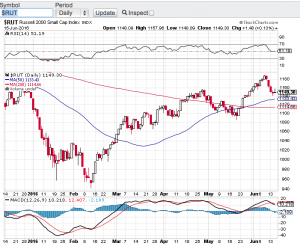
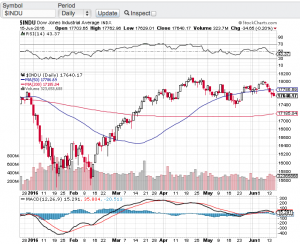
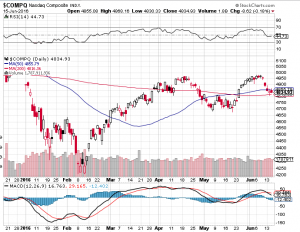
Stocks had a tough week pressured by the prospects of rising interest rates and political turmoil out of Washington D.C. On the week, the Dow Jones Industrial Average (see chart below) closed lower by 1.5%, the S&P 500 (chart) closed the week down 1.2%, the Nasdaq Composite (chart) finished lower by 1% and the small-cap Russell 2000 (chart) ended the week down around 1% as well. Despite a choppy and red trading week, all of the aforementioned indexes are still up on the year.

As we celebrate St. Patrick’s Day we find ourselves in a period of no real short term catalysts to steer the market in either direction other than the FOMC meeting next week. I don’t expect the Federal Reserve to surprise the markets with a larger than expected interest rate hike or change their view on interest rate policy this year. The inflation data continues to remain tame although the labor market is heating up. So what is going to drive stocks between now and Q1 earnings reporting season in April?

When we find ourselves in a period such as the one we are in, I focus in on the technical shape of the markets. And as you can see in the charts of the major averages, all of them are at their moving averages support. Whether it’s the 9 day, 20 day, 50 day, 100 or 200 day moving average, stocks and indexes typically respect and is supported by moving average support lines with the 200 day moving average being the most reliable out of all of them. This doesn’t mean that this favorite technical indicator of most market technicians is infallible, but it sure has a history of being an effective tool when navigating the markets. All things considered, including the seasonality of the markets, I do expect that these support levels should hold at least until Q1 earnings reporting season. If the moving averages don’t hold, then I would not be surprised if we revisit the early February market correction lows. Good luck to all and Paula and I wish everyone a safe and Happy St. Patricks Day 🙂

~George

Dow Jones Industrial Average - Paula Mahfouz

Finally A Tradable Market!

After years of essentially low to no volatility, traders finally get what they have been wishing for and that is a tradable market! In 2017 the markets witnessed the longest stretch of low vol in recent memory. In fact the VIX (see chart below) which is the ticker symbol for the Chicago Board Options Exchange volatility index traded in the 10 zone for most of 2017. The 10 level on the VIX (chart) is beyond abnormally low especially lasting for the better part of a year. Fast forward to today and the VIX is hovering around 20 after spiking to over 50 over the past two weeks. We haven’t seen the VIX (chart) at the 50 level in years. Call it long overdue, call it the market needed to correct, call it higher interest rates, call it what you want but finally we seemingly have more of a normal market environment. Not to say it wasn’t gut wrenching watching 1000 point Dow Jones Industrial Average (chart) intra-day swings over the past couple of weeks compared to the slow melt-up investors have enjoyed for years. Traders on the other hand have underperformed the markets during the melt-up because there simply was not enough or no volatility to be able to trade.

Stocks have indeed bounced sharply from the early February market correction. The Dow Jones Industrial Average (chart) closed the day up 307 points, the tech focused Nasdaq Composite (chart) closed up on the day 113 points, the S&P 500 (chart) closed up 32.5 points and the small-cap Russell 2000 (chart) finished the trading session up 15 points. Going forward I am certainly going to respect the technical make up of the aforementioned indexes and select stocks. Moving averages such as the 20-day, 50-day and 200-day tend to provide reliable support and resistance marks and now that we are out of the no vol environment, these moving averages tend to be more accurate and can be used to determined entries and exits in positions you hold and or trade. As I write this blog the key indexes have now rebounded to their 50-day moving averages so we will see if this technical indicator will act as resistance or if the markets can hold, breakthrough and proceed higher. Of course there is much more to consider when entering or exiting any position or strategy but when volatility comes back into the markets, most professional traders key in on the moving averages. Good luck to all 🙂

~George

VIX - Paula Mahfouz

No Fear Here…

Despite North Korea launching its seventh missile test of the year on Sunday and the White House seemingly in an upheaval, stocks continue to demonstrate no fear and continue their record setting ways. Today the S&P 500 (chart) and the Nasdaq (chart) hit all time highs. Without question this bull market is now even catching wall street veterans off guard. Q1 earnings reporting season is close to wrapping up and other than retail, most companies have reported in-line or outright beats in their earnings results, especially the tech sector. Tech has been on fire lately and this is due in large part of mega-cap tech smashing analysts expectations. Earnings results from companies such as Apple (NasdaqGS: AAPL), Amazon (NasdaqGS: AMZN), Alphabet (NasdaqGS: GOOGL) and Facebook (NasdaqGS: FB) has propelled the Nasdaq (chart) and these particular issues to all-time highs. The Dow Jones Industrial Average (chart) and the Russell 2000 (chart) remain in striking distance of setting new records as well. It is truly remarkable how the markets have been able to weather the current political environment here in the U.S. and the geopolitical risks abroad.

From a technical perspective, the aforementioned key indices are in pretty good shape. The Nasdaq (chart) is the only one of the four that remains in overbought territory according to the relative strength index. All of these averages also remain above their respective 50-day and 200-day moving averages, yet another bullish sign. Volatility also remains at historic lows. So one may ask what about the “sell in May and go away” adage? From a technical standpoint, I do not see any reason why these markets won’t continue to melt up from here. Of course there is always the risk of a geopolitical event or the actual seasonal risk of assets taking a pause or retracing a bit. That said and whatever the case may be, it is undeniable that the markets have been the most resilient in years, if ever.

Good luck to all 🙂

~George

What August Swoon?

Actually quite the contrary! In fact new all time highs occurred this past week with the S&P 500 (see chart below), the Dow Jones Industrial Average (see chart below) and the Nasdaq (chart, click here). What’s more is these record closing highs of the aforementioned indexes occurred on the same day last week, a feat that has not happened since the bubble of 2000. Now I am not suggesting we are in a bubble like we were in dot-com days. Back then valuations of dot-com stocks and most of technology were rather insane. That said, the current price to earnings ratio of the S&P 500 is in the 20’s which is historically high. That alone could be a catalyst for a pause and consolidation and/or a pullback from the record high territory we have been trading in.

I am almost frightened to think or suggest that a retracement of any type is forthcoming simply due to the way the markets have been trading in a typically weak market season. As mentioned in my previous blog, August tends to be one of the weakest months of the year for the stock market. There is still a couple of weeks left in August and it is not too late to see historic trends surface. However, the way stocks have traded lately and with no real economic or geopolitical catalysts in the foreseeable future, this market melt-up may indeed continue.

Technically speaking, the trend lines of the 20-day, 50-day and 200-day moving averages all remain in tact and are yielding upward and the relative strength index of the key averages are not officially in overbought territory. So this is enough for me to not really expect much out of the market in either direction as we head into Labor Day weekend and as the summer winds down. Good luck to all 🙂

~George

S&P chart george mahfouz jr

dow jones chart george mahfouz jr

What A Rollercoaster Ride!

This week started off with the vote no one expected. Global markets were shocked with the outcome of the United Kingdom’s vote to the leave the European Union. Here at home, the Dow Jones Industrial Average (see chart below) lost close to 1,000 points between Monday and Tuesday, the Nasdaq (see chart below) over that same two-day period lost close to seven percent as did the S&P 500 (chart) and the small-cap Russell 2000 (chart). A breathtaking 2-day drop which was so swift and profound that it violated the 200-day moving averages of all of the aforementioned indexes. Fast forward to today and what seemingly was the start of an angry correction, has turned into yet another “buy the dip” opportunity. No matter what the challenges are or have been on the macro-economic or political front, markets over the past several years have shrugged them off. I honestly did not think stocks would snap back this time as quickly and as powerfully as they have.

Yet again, oversold conditions created a trader’s dream with this snap-back rally. Ever since this bull market began, every shocking or unexpected headline which have rattled the markets have always been met with strong support that then turns into the resumption of this protracted bull market. However, it is also very clear that we have been trading in a range for quite some time now and every time we have tried to breakout of this trading range, resistance is met and we retrace back to a variety of moving averages.

So you may be asking how do we break out of this S&P 500 (chart) 2000 to 2120 trading range? One catalyst that can do this is the upcoming second quarter earnings reporting season which kicks off here in July. I do not think that the economy is such that record earnings results will come forward. In fact, companies may take it upon themselves to use the Brexit circumstance to soften their future guidance? We will see. In my humble opinion I think the possibility of a downward break is more probable in the near term than stocks breaking out to all-time highs, especially after this snap back rally. Good luck to all!

Paula and I wish everyone a safe and Happy 4th of July holiday 🙂

~George Mahfouz, Jr.
Dow Jones George Mahfouz JrNasdaq George Mahfouz Jr.

Looks Like A Double Top…

A recent attempt to breakout to all-time highs has seemingly failed. The Dow Jones Industrial Average (see chart below) , the tech-focused Nasdaq (see chart below), the S&P 500 (see chart below) and the small-cap Russell 2000 (see chart below) all appear to have “double topped” and have retreated to support lines. Without question growth concerns here in the United States are abound. These concerns escalated right after the release of May jobs report which was dismal to say the least. Couple these concerns with the potential of the United Kingdom leaving the European Union and its no wonder why the markets have pulled back over the past couple of weeks.

One of the risks to the markets that I highlighted in my last blog were interest rates. It appeared at the beginning of the month that the Federal Reserve and market pundits were all but certain that a rate hike would occur at today’s Federal Reserve meeting. Well thanks to the underwhelming May jobs report, no rate hike occurred this month and furthermore the Federal Reserve have lowered their outlook for any near term future increases! The Fed did say that they will be monitoring our economy and the data to guide them in their future policy decisions and sure enough they continue to stand by this protocol.

Now what? First for me, I want to see how the market reacts to next Thursday’s vote as to whether or not Britain leaves the European Union? Momentum does appear to be increasing for a British exit, which could lead to a global slowdown? Nobody knows if the referendum will pass or what type of effect this will have across the pond or here in the U.S. In the meantime, I will be monitoring the technical shape of our key indices and as you can see in the below charts each of these indexes have found support at either the 20-day, 50-day or 200-day moving averages.

Good luck to all 🙂

~George Mahfouz, Jr.

george mahfouz jr SPX chart

george mahfouz, jr Russell chart


george mahfouz jr Dow chart

george mahfouz jr nasdaq chart

Retail Stocks Retreat!

So does this mean the consumer have closed their wallets? The SPDR S&P Retail ETF (Symbol: XRT) which has over 500M in net assets with holdings in a wide variety of the retail space has lost over 10 percent over the past few weeks with 4.4% of this sharp decline  occurring last Wednesday alone. This was the largest one day drop for this widely followed retail stock ETF in almost 5 years. Some individual retailers have even fared worst over the past month or so as their earnings reports and outlooks have been bleak to say the least. Just take a look of the charts of Macy’s (Symbol: M) and Nordstrom Inc(Symbol: JWN) and you can see just how much these retails missed their earnings numbers and well as how they guided for the upcoming quarter and second half of the year.

No question the retail sector sell-off had an effect on the overall markets with the Dow Jones Industrial Average (chart) closing down over one percent on the week, the Nasdaq (chart) finished lower by one half of one percent, the S&P 500 (chart) closed lower by the same margin and the small-cap Russell 2000 (chart) closed the week out down over one percent.

As mentioned in my previous blogthe technical shape of the aforementioned indices appear to be breaking down and this past week did not help at all. So now it’s not just the 20-day moving averages that have been breached, each of these indexes have all now broken through their respective 50-day moving averages. What’s more, is we do not find ourselves in an oversold condition according to the relative strength index also known as the RSI. So with no real market moving catalysts this upcoming week, it is possible that the current selling pressure continues until oversold conditions occur or other support levels are hit. Good luck to all.

~George

First Quarter In The Books…

Q1 proved to be a mixed bag for the major averages. The Dow Jones Industrial Average (chart) closed out the first quarter up almost 1.5%, the S&P 500 (chart) finished up 0.77%, however, both the Nasdaq (chart) and the small-cap Russell 2000 (chart) finished out the first quarter of the year lower by 2.75% and 1.78% respectively. Not too shabby considering these key indices were down over 10% earlier in the quarter. This morning stocks are lower despite a stronger than expected  jobs report. In March, the economy added 215,000 jobs with the unemployment rate now at 5%.

With Q1 in the rear view mirror all attention will now be focused on first quarter earnings reporting season. The Commerce Department recently issued a report indicating that corporate profits were down 15% year-over-year. This does not bode well for stocks when the current p/e ratio’s of the major averages are well above their historic averages. With earnings reporting season just ahead, we will not have to wait too much longer to see how well corporate America is doing.

Let’s take a quick look at the technical shape of the markets. Most of the key indices are at or near overbought conditions, which has been the case for pretty much most of March. In my previous blog I eluded to what most market technicians look at when gauging overbought or oversold conditions. Furthermore and technically speaking, the major averages are all trading at or above their 20, 50 and 200-day moving averages with only the small-cap Russell 2000 (chart) chasing its 200-day. If you are bullish on the market, these moving average patterns are typically a good thing. That said, I do expect volatility to pick up a bit which is usually the case ahead of earnings reporting season. I will check back in mid-month or so to see how earnings growth actually appears.

Good luck to all 🙂

~George

Finally The Bulls And Bears Got What They Wanted!

A Correction! After years of not having a 10% or more correction in the markets and with August tending to be one of the worst performing months for equities, this was the perfect set-up for the long overdue correction in stocks to take place. However, just as fast as the stock market correction occurred, the ensuing snap back rally was equally eye-poping. For the month, the Dow Jones Industrial Average (chart) fell 6.57%, the tech focused Nasdaq (chart) lost 6.86%, the S&P 500 (chart) -6.26% and in the month of August the small-cap Russell 2000 (chart) experienced a 6.45% decline. Last week we did witness very rare market behavior with whipsaw action not seen since the 2008 financial market crisis. This brought back memories of how stocks and financial markets can irrationally behave as emotions and high frequency trading take over.

The question now is, is this type of market volatility over? I don’t think so. Let’s first take a gander of the technical health of the four major averages. Without question, short term technical damage in these key indices have occurred. Each one of the index have fallen sharply and have closed below their respective 200-day moving averages. Furthermore, today at the open and for the first time in years, the S&P 500 (chart) will have its 50-day moving average crossover its 200-day moving average. Technically and historically speaking, this is not usually a good thing. The Dow Jones Industrial Average (chart) saw its 50-day crossover its 200-day in the middle of August only to experience exhaustive selling thereafter. The good news technically is that stocks had been way oversold to the point 0f capitulation. Hence, the ensuing sharp rally from the most recent lows.

So where do we go from here? I suspect that we will continue to experience outsized market moves in both directions and trading this kind of market environment is not for the feint of heart. I revert back to a more conservative approach starting with identifying the most current “best of breed” in their respective industries. The first prerequisite for me in identifying potential investment candidates in this type of market environment is for companies to have pristine balance sheets with little to no debt levels. However, if they do have debt they must have have historic and current cash flows that can easily service their debt. Without this and in today’s market I have no interest on really owning anything. Of course there are many other metrics that do apply but for me personally the balance sheet is where it begins. Another huge factor for me especially today is to implement disciplined  “protective stops” in any positions I hold. This ensures that your portfolio is somewhat protected should the markets decide that we are in the early innings of this correction. With that said and especially in today’s market, please consider consulting with a trusted certified financial planner(s) before making any additions or modifications to your own portfolio.

Both Paula and I wish everyone a very safe and Happy Labor Day holiday weekend 🙂

~George