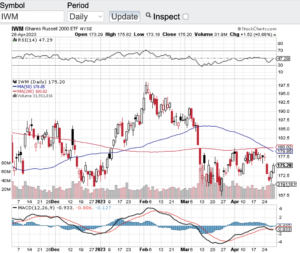
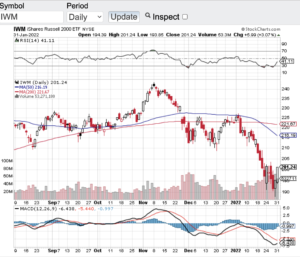
After breaching all moving average support lines including the 200-day, the major averages have their rally caps on! The Dow Jones Industrial Average (see chart here) finished the month of April on a high note. The same can be said for the S&P 500 (see chart here), the Nasdaq Composite (see chart here) and the small-cap Russell 2000 (see chart here and below).
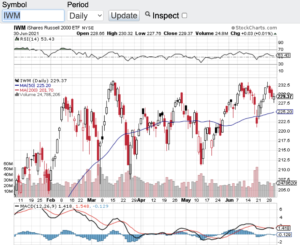
After a slow start to the year including a brief dance with a bear market, stocks have rallied recently to turn green. Even the small-cap Russell 2000 is now green for 2023. So, what is causing the renewed bullish action? In part I think a stronger than expected first quarter earnings results have played a role in this latest bull run along with the Federal Reserve potentially slowing down their interest rate hike program. Positive earnings surprises have come from the health care sector, consumer discretionary and Industrials sector. It’s not just better than expected earnings results, it’s the top line revenue numbers that are also coming in stronger than expected. These data sets are great to see but we still do have some headwinds with inflation remaining high which means the Federal Reserve may not be quite done yet with higher rates.
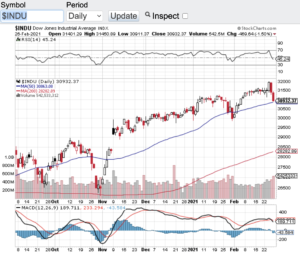
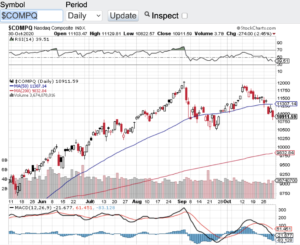
When I take a look at the technical shape of the markets, there are some encouraging signs that may play a role in the continuation of this latest bull run. It appears that the Dow Jones Industrial Average (see chart here) is breakout out of a month’s long trading channel, as is the S&P 500 (see chart here) and the Nasdaq Composite (see chart here) also appears to be breaking out. I also see that the aforementioned indexes have not yet breached the 70 value level of the Relative Strength Index aka the RSI. The 70-value level of the RSI is considered the beginning of overbought conditions and we are not there yet.
Let’s see how the month of May goes and we will check back on the technical shape of the markets in June. Good luck to all 🙂
~George