$7.4 Billion In One Day!
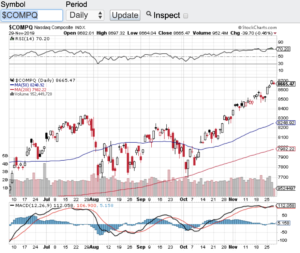
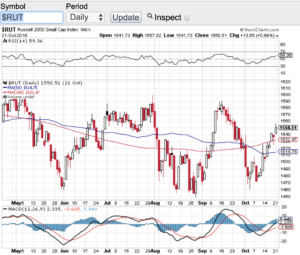
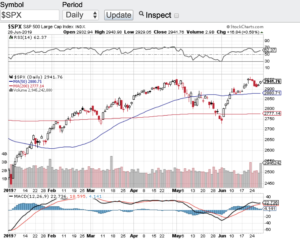
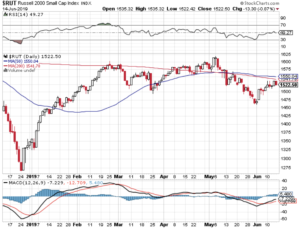
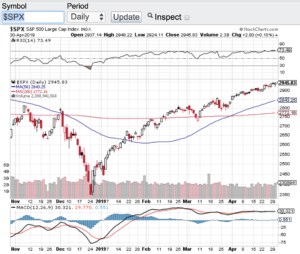
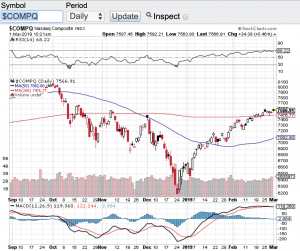
The consumer is alive and well which is evidenced by a record $7.4 billion in online sales in one day. Black Friday set a United States record for online sales and between Thanksgiving Day and Black Friday over $11 billion in online sales rang the register. Well it’s not that hard to believe when all that the stock market has done this year is set record after record. As we enter the last month of the year, the Dow Jones Industrial Average (see chart here) is trading above 28000, the S&P 500 (see chart here) starts December near an all-time high, the Nasdaq Composite (see chart below) is also near an all-time high and the small-cap Russell 2000 (see chart here) also has hit its stride breaking out above a triple top that has formed over the past few months.
I have been writing my blog for almost 10 years and I thought years one through five of the recovery from the depths of the 2008 financial crises was impressive. What’s even more impressive to me is that over the past year or so we keep setting record after record despite having one of the most unstable governments in our history. Who would have thought that with a pending impeachment, a trade war with China and tape bomb after tape bomb hitting the tape we would still be at or near record highs? Simply incredible! With that said, the Federal Reserve has done its part this year by reducing interest rates which is probably one of the main reasons the markets still remain at or near record highs.
The technical shape of the stock market appears to still be intact. Despite reaching overbought conditions last week, Friday’s pullback brought the RSI level of the aforementioned indexes back below the 70-value level. The relative strength index is a technical indicator that expresses overbought and/or oversold conditions. The 70-value level of the RSI is considered overbought while the 30-value level is considered oversold. The major indexes all traded above the 70-value level until the most recent pullback. Even if we see a meaningful pullback here in December, there are plenty of support levels that will come into play with the 20-day, 50-day, 100 and 200 day moving averages which are all below where we are trading at today and historically acts as support in sell-offs.
Good luck to all 🙂
~George