It Just Keeps Rolling!

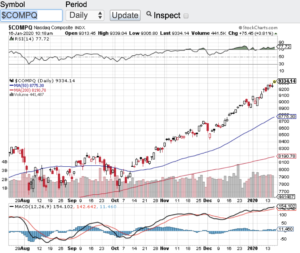
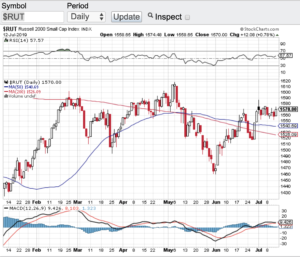
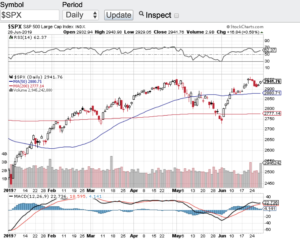
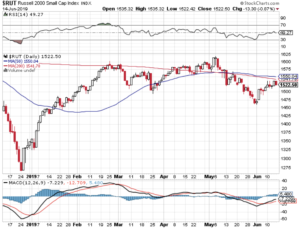
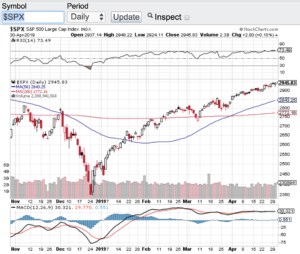
The stock market that is! Stocks just keep rolling along as we are now in the new trading year. The beginning of 2020 mirrors the record setting ways of 2019. The S&P 500 (see chart here) broke the 3,300 mark for the first time ever today. The Dow Jones Industrial Average (see chart here) is trading above 29,000, the Nasdaq Composite (see chart below) appears to be on its way to 10,000 and the small-cap Russell 2000 (see chart here) is approaching its all time record high.

As I have eluded to in my blog over the past years, this market tear is something no one has really witnessed. Actually all of this started since the crash of 2008. Who could of ever imagined back then that the Dow Jones Industrial Average would flirt with the 30,000 level? In fact, markets around the world were on the verge of collapse and banks were bracing for a bank run. My goodness how times have changed. This breath taking run started with the Federal Reserve dropping rates to record lows and buying up debt. To this day the Federal Reserve is still playing a critical role in this record setting stock market which is a big reason why the markets just keep rolling.

Now it is up to corporate America to show their chops. Earnings reporting season is kicking off and if the report cards are anything like what Morgan Stanley reported today, the bulls will continue to eat caviar. Morgan Stanley (NYSE: MS) had revenues of over $10B exceeding all expectations. In fact, earnings reporting season is off to a strong start with the majority of companies who have reported so far have exceeded street estimates. Now in fairness earnings expectations have been ratcheted down by analysts but still it is undeniable that corporate earnings are still showing strength. This is just the beginning of reporting season so let’s see how the coming weeks look as we continue to set record highs. Good luck to all ๐Ÿ™‚

~George

It Just Keeps Rolling George Mahfouz

$7.4 Billion In One Day!

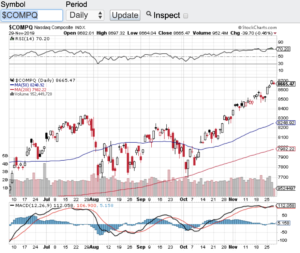
The consumer is alive and well which is evidenced by a record $7.4 billion in online sales in one day. Black Friday set a United States record for online sales and between Thanksgiving Day and Black Friday over $11 billion in online sales rang the register. Well itโ€™s not that hard to believe when all that the stock market has done this year is set record after record. As we enter the last month of the year, the Dow Jones Industrial Average (see chart here) is trading above 28000, the S&P 500 (see chart here) starts December near an all-time high, the Nasdaq Composite (see chart below) is also near an all-time high and the small-cap Russell 2000 (see chart here) also has hit its stride breaking out above a triple top that has formed over the past few months.

I have been writing my blog for almost 10 years and I thought years one through five of the recovery from the depths of the 2008 financial crises was impressive. Whatโ€™s even more impressive to me is that over the past year or so we keep setting record after record despite having one of the most unstable governments in our history. Who would have thought that with a pending impeachment, a trade war with China and tape bomb after tape bomb hitting the tape we would still be at or near record highs? Simply incredible! With that said, the Federal Reserve has done its part this year by reducing interest rates which is probably one of the main reasons the markets still remain at or near record highs.

The technical shape of the stock market appears to still be intact. Despite reaching overbought conditions last week, Fridayโ€™s pullback brought the RSI level of the aforementioned indexes back below the 70-value level. The relative strength index is a technical indicator that expresses overbought and/or oversold conditions. The 70-value level of the RSI is considered overbought while the 30-value level is considered oversold. The major indexes all traded above the 70-value level until the most recent pullback. Even if we see a meaningful pullback here in December, there are plenty of support levels that will come into play with the 20-day, 50-day, 100 and 200 day moving averages which are all below where we are trading at today and historically acts as support in sell-offs.

Good luck to all ๐Ÿ™‚

~George

$7.4 Billion In One Day! - Paula Mahfouz

Third Rate Cut Of The Year…

The Federal Reserve provided its third rate cut of the year on Wednesday. Although this was very much expected, until it happens you don’t know. Without question the Fed’s actions this year has helped the markets hit new highs throughout the year. This week has been no different. Despite pulling back a bit yesterday the Dow Jones Industrial Average (see chart here) remains above 27000, the S&P 500 (see chart here) hit a fresh all-time high on Wednesday, the Nasdaq Composite (see chart here) is within 50 points of its all time high and the small-cap Russell 2000 (see chart below) is trading above its 20, 50, 100 and 200-day moving averages. A technically healthy sign.

What has allowed the Federal Reserve to be proactive in cutting rates is the fact that inflation is pretty much non-existent. If inflation was present in a meaningful way I am not sure the Fed would be cutting rates at all. A huge side effect to lower rates is a strong stock market. So it’s no wonder we continue to trade at new highs and at the very bare minimum hold strong near the upper bands of the trading range. A couple of other factors that are supporting the markets are the latest round of corporate earnings reports which are coming in a bit better than expected along with some positive news flow out of the China trade negotiations.

With this latest rate cut I would not be surprised to see a continuation of the current upward trend and also potentially see new all-time highs before year-end. As I look at the technical shape of the aforementioned indexes pertaining to the relative strength index and the moving averages, I don’t see any issues there either. The Dow Jones Industrial Average (chart), the S&P 500 (chart), the Nasdaq Composite (chart) and the Russell 2000 (chart) are all above their respective moving averages which historically provides support on pullbacks and none of these indexes are in overbought territoryย  according to the relative strength index (RSI) principles.

Good luck to all ๐Ÿ™‚

~George

Third Rate Cut Of The Year - Paula Mahfouz


First Rate Cut In Over A Decade!

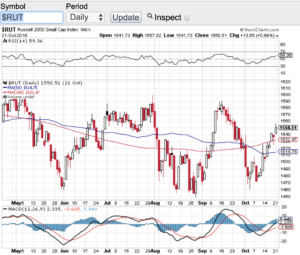
Yesterday the Federal Reserve conducted its first rate cut in over a decade! Although widely expected, the markets were disappointed as to how Fed Chairman Jerome Powell signaled that this is does not necessarily mean more rate cuts are forthcoming. Chairman Powell’s statement sent stocks down sharply. The Dow Jones Industrial Average (see chart here) closed down over 330 points, the S&P 500 (see chart here) closed lower by 32.80, the Nasdaq Composite (see chart here) finished down almost 100 points and the small-cap Russell 2000 (see chart below) finished the day down 11 points. The markets were hoping that Mr. Powell would remain dovish and it was clear he was the opposite. That said, a rate cut is a rate cut and the intention is to keep the economy moving. Despite the rate cut move, The White House came out and complained about how Chairman Powell handled his statement and it is no secret that administration wants further rate cuts. I do think additional rate cuts may not be needed due to how Q2 earnings reporting season is going so far. The street was expecting an “earnings recession” at least in the last quarter. But as we are now half way through earnings reporting season, so far so good. There are not many earnings surprises to the downside and future guidance is not too shabby so far.

Let’s take a look at the current technical shape of the markets. The indexes have been going sideways as of late with the exception of yesterday’s selloff. That said, yesterday’s selloff did break the 20-day moving averages of the Dow Jones Industrials, the S&P 500 and the Nasdaq Composite, however, the small-cap Russell 2000 closed above its 20 day and actually demonstrated more relative strength than the other averages. A one day selloff does not necessarily mean the beginning of a new downward trend so let’s wait and see how the rest of earning reporting season goes and then we can assess how the back half of the year shapes up.

Good luck to all ๐Ÿ™‚

~George

Russell 2000 - Paula Mahfouz


Dow, Nasdaq And S&P All At Record Highs!

The Dow Jones Industrial Average (see chart here), the Nasdaq Composite (see chart here) and the S&P 500 (see chart here) are all at record highs. Stocks continue to be on a tear with 3 of the 4 major indexes closing at all time highs on Friday. What’s more the S&P 500 (see chart here) closed above the 3000 mark for the first time ever. The one index that still has work to do before making a new high is the small-cap Russell 2000 (see chart below). I am not exactly sure why the Russell is lagging behind the big boys but if the Russell 2000 gets going then who knows how many more records will fall.

That said, for the first time in a while the Dow Jones and the S&P 500 have both entered into overbought territory which is above the 70 value level of relative strength index also know as the RSI. The Nasdaq Composite is fast approaching overbought conditions as well. The Russell 2000 is no where near overbought. I do expect a bit of a pullback in the coming weeks which would be rather healthy for stocks after such a strong performance. I have never been a fan of buying into record highs although momentum traders would disagree. Another factor to consider is we are heading right into second quarter earnings reporting season. Earnings reporting season could be a catalyst to pause the summer rally especially with the percentage of companies issuing warnings so far (click here)

The tariffs that our administration have imposed is expected to have a negative effect on the top and bottom lines of many U.S. companies. What I will be looking for is how much of an affect these tariffs are having on corporate America. The other side of the coin is if tariffs weigh heavier than what is anticipated, this could be yet another reason for the Federal Reserve to move to cutting interest rates which is the real reason I think we are hitting all time highs. Good luck to all ๐Ÿ™‚

~George

Russell 2000 - Paula Mahfouz


One Hot June!

One hot June indeed and I do not mean the weather folks! Stocks and commodities went on a tear in the month of June logging the best June in decades for some of the indexes and other asset classes. The Dow Jones Industrial Average (see chart here) soared over seven percent last month. The S&P 500 (see chart below) hit an all time high in the month of June while both the Nasdaq Composite (see chart here) and the small-cap Russell 2000 (see chart here) notched impressive gains as well. What’s more is both oil and gold surged right along side of the key indexes.

So why the rally? I think the answer is simply an easier monetary posture by the Federal Reserve. It is no secret that inflation is well in check and it is also becoming apparent that the U.S. job market is cooling off. Another factor for the Fed to consider is what impact would a full blown trade war with China do to the U.S. economy? This is why in my opinion we are seeing a continuing upward trend in our markets and that is a dovish Fed is usually very good for stocks. One other factor that will certainly weigh in is the upcoming earnings reporting season. Now that the second quarter of the year is in the books we will see how well corporate America did in Q2 as earnings reporting season gets underway this month. I will continue to look to monitor how “top-line” growth is faring.

Let’s take a quick look at the technical shape of the key indexes. After surging over 7% in June, the Dow Jones Industrial Average (see chart here) remains clearly above its 20-day, 100-day and 200-day moving averages as does the S&P 500 (see chart here). The Nasdaq Composite (see chart here) is in a healthy technical condition and last but not least, the small-cap Russell 2000 (see chart here) has broken above its key moving averages. This is a very good sign for stocks and furthermore none of indices are in overbought territory according to the principles of the RSI also known as the relative strength index.

Both Paula and I wish everyone a very safe and Happy 4th of July holiday ๐Ÿ™‚

~George

S&P 500 - Paula Mahfouz


Fed Rate Cuts Back In Play?

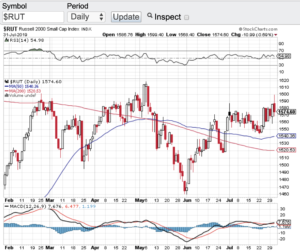
The question over the past week or so is whether or not Fed rate cuts are back in play? The May jobs numbers were way below expectations with the economy only adding 75,000 jobs. This is a far cry from the 180,000 that economists were expecting in the month of May. As intuitive as it seems a weak jobs report should equal a continuing sell-off in the markets. Not the case in the first half of the month for stocks. In fact the Dow Jones Industrial Average (see chart here), the S&P 500 (see chart here), the Nasdaq Composite (see chart here) and the small cap Russell 2000 (see chart below) all have rallied sharply so far this month. So how is it that stocks are rallying with a slowing job market? Two out of the past four months the jobs number has come in below 100,000. This is giving hope to the markets that the Federal Reserve may actually start cutting interest rates as opposed to raising them and this is why the markets are rallying. Lower interest rates has been a boon for stocks for the past decade and if the Fed starts lowering rates again, we could see all-time highs again.

What’s more is the technical shape of the aforementioned key indexes. As stocks have rallied this month, 3 out of the 4 major averages have blown through their moving averages which can provide resistance point if a stock or index is trading below their respective averages. Since the June rally began, the Dow Jones Industrial Average (click here for chart) recaptured it’s 200-day, 100-day and 20-day moving averages as did the S&P 500 ( click here for chart) and the Nasdaq Composite (click here for chart). However the small-cap Russell 2000 (click here for chart) has run into its 100 and 200 day moving averages and has found resistance at these key pivot points.

Let’s see how the rest of June goes and see if this past weeks consolidation will offer yet another leg up in the markets. Good luck to all ๐Ÿ™‚

~George

Russell 2000 - George Mahfouz Jr

Strong Economy Equals A Strong Stock Market!

The economy posted a 3.2% gain in the first quarter and as the saying goes, a strong economy equals a strong stock market! Is it any wonder as to why the Nasdaq Composite (see chart here) hit an all-time high on Monday! The same rings true with the S&P 500 (see chart below). The S&P 500 hit an all-time high on Monday as well. Now the Dow Jones Industrial Average (see chart here) has a bit more work to do in order to tap its own record as does the small-cap Russell 2000 (see chart here). However, I am sure the bulls will take 2 out of the 4 major averages setting all time highs. What is also helping the stock market is how the Federal Reserve has taken a cautious approach to raising rates any further. In fact, there are calls out of Washington DC asking the Fed to start lowering rates to stimulate the economy even further. Now I am not so sure that the Fed will accommodate Washington’s request, but I do think it is safe to say that we should not see a rate hike in the near future or maybe not at all for the rest of this year.

One note of caution to me is that with nearly half of corporate America reporting their Q1 earnings so far, we are seeing on average a year over year decline in earnings. There are still 100’s of companies set to report over the coming weeks but if this trend continues, this will be the first year over year decline in corporate earnings in years. I will be keeping an eye on this development.

The technical shape of the aforementioned indexes remain intact. The Dow, Nasdaq, S&P 500 and the Russell 2000 all are trading above their respective key moving averages. However, both the Nasdaq Composite (see chart here) and the S&P 500 (see chart here) have entered into overbought territory according to the relative strength index also know as the RSI. That said, I would not be surprised to see at the very least some consolidation or an outright healthy pullback. Good luck to all ๐Ÿ™‚

~George

S&P 500 - Paula Mahfouz

Best Start Of The Year In Decades!

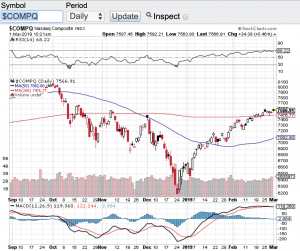
Stocks have opened the month of March rip roaring again adding to the best start of the year for the averages in decades. The Dow Jones Industrial Average (see chart here) opened the trading day up over 200 points, the S&P 500 (see chart here) opened up over 20 points, the Nasdaq Composite (see chart below) opened up over 55 points and the small-cap Russell 2000 (see chart here) opened up over 11 points. These gains are adding to the double digits percentage gains the markets have already realized in 2019.

So why such a strong start to the year? I am not trying to sound like a broken record but this 10 year long bull market is a head scratcher.ย  No matter what has been thrown at one of the longest bull markets in history, nothing seems have an adverse affect. You name the crises and stocks shrug it off. Whether it is a geopolitical event, the Federal Reserve raising rates or the daily chaos that comes out of Washington, nothing has disrupted this incessant rise in stocks. We did get a definitive correction late last year in where the bears came out of hibernation and predicted the end of the bull market and that a 40% correction is now imminent. Well don’t look now but we are not too far off from setting new all time highs in the aforementioned indexes.

Technically speaking it appears that the coast is clear for now as well. All of the major averages are now trading above their respective 20-day, 50-day and 200 day moving averages which is a very bullish sign. The one caveat to the technical shape of the market is that stocks are a bit overextended. Overbought conditions do exist technically and according to the relative strength index also known as the RSI. That said, the pullbacks that do occur continue to be met with support with buyers stepping in willing to add to their existing positions or open up new positions. The trend remains your friend in our current environment. Good luck to all ๐Ÿ™‚

~George

Nasdaq Composite - Paula Mahfouz

What Bear Market?

The major averages in December entered into bear market territory and seemingly was heading even lower. But lo and behold and fast forward to today and we see that the key indices have all come roaring back.ย  The definition of a “bear market” is when a stock or an index goes down 20% or more from its highs and that was definitely the case in the second half of 2018. The Dow Jones Industrial (see chart here) is now back over 24,000 after dropping below 22,000 in December, the S&P 500 (see chart here) is back over 2,600 after dropping below 2,400, the Nasdaq Composite (see chart here) is now over 7,100 after hitting a low of 6,190 and the small-cap Russell 2000 (see chart here) it trading above 1,400 after hitting a low in December of 1,267.

The sharp V shaped bounce back in such a short period of time is very impressive. I do not think anyone expected such a sharp rebound in just a month. This surprise move is also happening despite the ever increasing chaos and turmoil out of Washington DC. Is it me or has it gotten to the point of utter disgust with what is happening to our country. I am not much of a political advocate in either direction but the narcissism and antics coming out of DC is unbelievable. What’s more is that they are using the government shutdown as the pawn to get their way, again unbelievable.

Ok enough of that and back to the markets. We are now heading straight into earnings reporting season and to me this without a doubt will be a significant catalyst as to whether or not stocks will continue to rise or pause. Of course any type of meaningful progress with the trade war and China could also play a major role. The Federal Reserve has been more vocal with interest rates and indicating that they are more apt to more of a wait and see approach as to any additional rate hikes in near term. There is a lot at hand here which should determine whether or not this bounce back rally will continue. Good luck to all ๐Ÿ™‚

~George