What A Wild Week!
What a wild week it was for the stock market and currency markets. From earnings reporting season kicking into high gear to the Federal Reserve keeping interest rates steady and to the dollar/yen carry trade, market swings were wild.
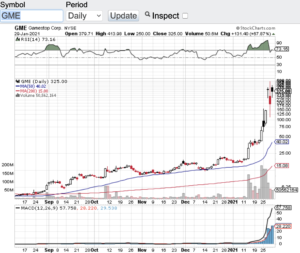
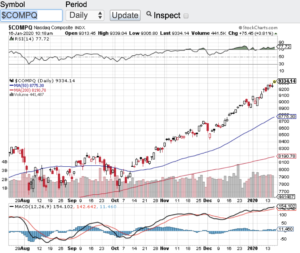
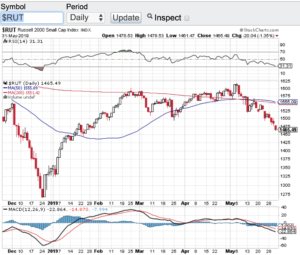
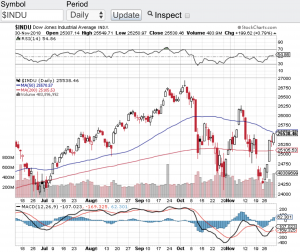
The Dow Jones Industrial Average (see chart here) closed the week up at 52,485 while crossing back over its 20-day moving average (M/A). The S&P 500 (see chart here) closed the week at 7,490 which is right at its 20-day M/A. The Nasdaq Composite (see chart here) also closed the month of July in the green closing at 25,373, however, the small-cap Russell 2000 (see chart here) closed the month out in the red at 2,931 while also closing below its 20-day and 50-day M/A. The VIX (see chart here) was also bouncing around this week but closed on the low end of its weekly range. The VIX measures the implied volatility of the S&P 500 and is also known as the “fear index”. When the VIX spikes which it did this week it’s an indication of increased fear and risk in the market.
What’s causing all this sentiment? As mentioned above, earnings reporting season has kicked into high gear with companies reporting a mixed bag of results. The highly anticipated Federal Reserve meeting which happened on Wednesday where the new Fed Chairman Kevin Warsh came to the podium and kept interest rates steady. When that news hit stocks sold off along with expectations of any rate cuts this year. Finally, the dollar/yen carry trade came into focus and this one is the big one folks.
Basically the dollar/yen carry trade is when hedge funds and/or institutional investors borrow money in yen denominated currency where interest rates have been extremely low and you covert those yen into U.S. dollars, then you invest those dollars into higher-return assets such as U.S. stocks Treasury bonds etc. you keep the spread and earn much higher returns. The problem lately is the yen has strengthened against the U.S. dollar and now your loan has come much more expensive in dollar terms. When this occurs these hedge funds and institutional investors respond by selling U.S. based assets to reduce their exposure. In addition to the Japanese yen getting stronger, the central bank of Japan is also considering raising interest rates and should that occur, the yen gets even stronger. Efforts are being made to stabilize the dollar/yen carry trade by both governments, let’s see if this trade stabilizes next week.
Good luck to all 🙂
~George