A Stunning Comeback!
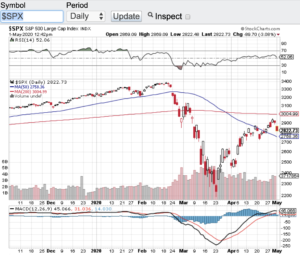
Stocks pulled off one of the most stunning comebacks in recent memory. Despite Covid-19’s rapid acceleration which is afflicting millions, the stock market made one of the sharpest and quickest recoveries off of the bottom we hit in late March. The Dow Jones Industrial Average (see chart here) gained over 11% in April, the S&P 500 (see chart below) posted a 12.7% gain, the Nasdaq Composite (see chart here) closed up over 15% and the small-cap Russell 2000 (see chart here) posted a whopping 22% gain in the month of April. Let’s not forget we are still off of the all time highs set earlier in the year but I don’t think anyone expected the magnitude of the rally that we just witnessed. There is no question that hopes of re-opening the economy and the latest advancements on therapeutic treatments and vaccines also played a role in the April rally.
Let’s look at it deeper than the just scientific advancements. The Federal Reserve actions and the recent stimulus packages issued by our government has also played a significant role in the eye-popping rally. With all of constant news flow and developments that comes out on Covid, I do think it is hard to realize how impactful the government stimulus packages and the new Federal Reserve stance is and what it does mean to the economy and markets now and going forward. I think it is fair to assume that once there is a definitive and stabilizing solution for the Covid crisis, that our economy and markets should have no problem taking off again. Until then, let’s all pray for a rapid solution to this ugly virus that has wreaked havoc on society. I do believe and have always believed in humanity and for science to lead the way.
Let’s take a quick look at the current technical shape of the the key indexes. We can all expect the markets to pull back after such a sharp bounce back rally. This is the case as I write my blog today. The markets are pulling back to their 20-day moving averages. Typically the 20-day, 50-day and especially the 200-day moving average acts as near term support levels. Let’s see if the current 20-day moving average holds as a near term support level as we head into the weekend.
Good luck to all 🙂
~George