The Economy Is Booming, But…

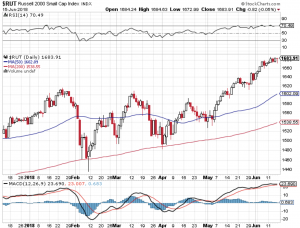
There is no question the economy is booming but what does this mean long term for stocks? When the economy is firing on all cylinders like it is now here in the United States one may think the stock market must be ready for its next leg up! Not so fast. Historically when the economy heats up and the unemployment rate becomes so low, that does not typically bode well for stocks. Why you ask? Simply put, the Federal Reserve does not want inflation to rear its head up and their main tool to avert inflationary pressures is to raise interest rates. As counterintuitive as it may seem, a strong economy and low unemployment may be the catalyst to put the brakes on this almost 10 year bull market run. That said, the major averages continue to show extraordinary resilience no matter what comes at it. The Dow Jones Industrial Average (chart) closed the week above 25,000, the S&P 500 (chart) finished the week at 2779, the Nasdaq Composite (chart), finished near its all time high and the small-cap Russell 2000 (see chart below) closed the week out a few points away from it’s all time high as well.

It is quite remarkable how the aforementioned indexes are behaving with all things considered. This past week the Federal Reserve raised interest rates again and signaled two more hikes this year and the trade war chatter and action with China and our own allies for that matter is accelerating. Just these two events alone show be putting selling pressure on stocks not setting new record highs as is the case this past week with the Nasdaq Composite (chart) and the Russell 2000 (chart). These indexes also remain well above key moving averages which at some point in time reversion to the mean should occur. I will be looking for opportunities on the short side but will continue to respect the fact that this years-long bull market remains intact at least from a technical standpoint. Good luck to all 🙂

~George
george mahfouz jr - Russell 2000


Despite A Month End Rally, Stocks Took It On The Chin!

January proved to be one of the toughest months for stocks in years. The Dow Jones Industrial Average (chart) closed the month down 5.5%, the Nasdaq (chart) closed down 8%, the S&P 500 (chart) fell 5.1% and the small-cap Russell 2000 (chart) finished the month out down almost 9%. If it wasn’t for the strong month end rally, both the Nasdaq (chart) and the small-cap Russell 2000 (chart) would of closed out in correction territory. Clearly China and Oil continue to grab the headlines and continue to make investors very nervous. However, on Friday the Bank of Japan in a surprise move implemented negative interest rates for the first time ever in an attempt to aggressively stimulate their struggling economy. So once again a central bank acts and the markets respond. Even our own Federal Reserve stated last Wednesday that they are on high alert pertaining to the global markets and the affects that are being felt here at home. In other words, there may be a pause in raising interest rates here in the U.S.?

That said, what never ceases to amaze me is how technically disciplined the markets can be. If you look at the major averages over the past two weeks you will see that all of these key indices held their August 2015 lows. Especially the Dow (chart) and the Nasdaq (chart) which traded down almost to the nickel to their respective August lows. In my previous blog I cited the Federal Reserve and their policy shift to raising interest rates and the fact that now markets and equities can be assessed on their own merits versus what the central banks may or may not do. Well Friday’s Bank of Japan’s move is a reminder that central banks around the world are ready and capable of intervening at any point in time. Which brings me back to this, how in the world can you confidently have a short thesis in these markets? In my opinion, this model is simply too risky when you have monetary policies that can turn on a dime.

So what’s an investor or trader to do? One thing that stands out to me is throughout all of the noise and chatter is that the technicals continue to perform with the utmost efficiency. Whether markets or equities are overbought or oversold vis-à-vis the relative strength index (RSI) , or support lines are met and hold. No one can deny how disciplined and efficient technical analysis can be.

Good luck to all 🙂

~George

Stocks Are In A Tailspin!

After starting the year off in sell mode, stocks are accelerating their declines and are now in correction territory. Yesterday’s rally sparked hope that a short term bottom was put in, however, this is not the case as the Dow Jones Industrial Average (chart) plunged 400 points at today’s open, the Nasdaq (chart) opened lower by over 100 points, the S&P 500 (chart) opened down over 2% and the small-cap Russell 2000 (chart) is now trading below 1000. What gives? First and foremost, China’s Shanghai Composite Index has lost over 20% of its value since late December and is now in a bear market. China’s market fall has indeed spilled over into the global markets. Secondly, crude oil (chart) has continued to decline and is now trading below $30 per bbl spreading fears of widespread bankruptcies in the oil and gas space. These two factors alone have been enough to send our markets into correction mode.

That said, what I try to do in this type of market environment is to place emotions in check and to keep things into perspective. Since this bull market began in 2009, we have not really experienced a market correction. Yes, it has been over six years since we have had a meaningful market decline that has stuck. People tend to forget that market corrections can be a very healthy thing for an overextended market. Investors and traders alike have been spoiled over the past six years by essentially taking their positions and switching on auto-pilot. I believe those days are gone and they should be. When the Federal Reserve took action and began their aggressive monetary policies i.e. buying bonds and placing interest rates at or near zero, stocks took off and did not look back. We have not been in a normalized market environment since then.

Fast forward to today and with essentially no Fed intervention and with a change in interest rate policy, we now have markets trading off of economic and corporate merits. This to me is not a bad thing because now investors can assess the value of the markets as well as individual stocks more accurately and more confidently. This is a concept that most traders and investors have been waiting on and that is to make their investment decisions based off of facts and not what the Federal Reserve will or will not do.

Good luck to all 🙂

~George

Are Stocks Poised To Breakout?

After an early November sell-off, the major averages could be on the verge of a breakout, at least from a technical point of view. The noticeable dip in equities that occurred recently was met with strong support and now stocks have rallied up to key resistance levels. The Dow Jones Industrial Average (chart) closed the month of November at 17720, the Nasdaq (chart) closed at 5109, the S&P 500 (chart) closed at 2075 and the small-cap Russell 2000 (chart) closed the month of November at 1198. As you can see by their charts the three top indices have resistance levels of 18,000, 5175 and 2125 respectively while the small-cap Russell 2000 (chart) is seemingly on the verge of breaking out. That said, it takes more than a day or two trading above a resistance level with strong volume to confirm a breakout. What could be in favor for a breakout with all of the aforementioned indexes is the seasonality of the markets a.k.a. the Santa Clause rally. This could very well be the catalyst for a year-end rally.

What could get in the way of a potential Santa Clause rally? One example could be if the technical resistance line(s) holds true to form and the key indices cannot breakout with conviction above these marks . There is also the risk of China’s market continuing to abate as regulators are cracking down on trading practices of major Chinese brokerage firms. The China weakness can spill over here to our shores even if it is only a short-term consequence. Of course there is always a geo-political risk that could weigh in on market sentiment and behavior. And last but not least, the Good Ole Federal Reserve and whether or not they would implement their first rate hike in almost a decade when they meet later this month.

That said and notwithstanding any of these risks, we have seen stocks incredibly resilient during this multi-year bull run and I would not be surprised if we indeed breakout and experience a year-end rally that could challenge the all time highs. Good luck to all 🙂

~George

Despite A Pop In Volatility, Bull Market Remains Intact!

In the month of July, the major averages continued to demonstrate what a bull market looks like despite an increase in volatility $VIX (chart )and global macro concerns. For the month, the Dow Jones Industrial Average (chart) closed up a modest 0.40%, the Nasdaq (chart) gained 2.8% in July, the S&P 500 (chart) advanced 2.0% and the small-cap Russell 2000 (chart) actually ticked down on the month giving up 1.28%. One interesting note and if you look at the charts of the above mentioned indices, in the month of July each of these indexes breached their 200-day moving average and three of the four breached this support line twice only to rebound sharply and keep the technical makeup of the markets intact. Without question and throughout this six year long bull run, the technicals of stocks and indexes have done their job and has acted as technicians would expect.

Fast forward to today August 1st and if you have been on Wall Street long enough, yes we are now entering the dog days of summer. As Q2 earnings reporting season works its way through and begins to wind down, I would expect volatility also begin to abate as it has towards the latter part of this past week. Without question these markets could still react to China’s extreme volatility as of late or if there is a big surprise in next week’s job’s report, however, without any big surprise here or overseas, I think this becomes a stock-pickers market as well as a technically traded market paying attention to trend lines and overbought and oversold conditions. This could also be the perfect environment to sell put option premium on your most favorite stocks in order to generate some additional income. One other option which may be a very valid one, and that is turn off your screens and head to the beach until after Labor Day :-).

Whatever you choose to do as we enter the “dogs days of summer” it is always best practice to consult with a certified financial planner(s) before making any investment decisions or changes to your portfolio. Good luck to all 🙂

~George

Nasdaq Closes At A Record High!

Tech stocks have taken off this week due to their strong earnings results. Companies such as Netflix (NasdaqGS: NFLX) soared 18% today after the company reported better than expected subscriber growth. Also today and just after the close, Google (NasdaqGS: GOOGL)  too reported better than expected results with revenue coming in at $14.35 billion compared to $14.26 billion the street was expecting. In after hours trading Google is up over 10% or well over $70.00 per share. Thanks to Google’s earnings results, most other tech companies are also trading up in the after-hours session so it appears that the rally on the Nasdaq (chart) will continue at least through tomorrow.

On a technical note, I want to point to your attention how two of the most influential major averages held their respective 200-day moving averages recently. A little over a week ago the markets were roiled in the Greece debt drama as well as how China’s stock market was falling off a cliff. There was enormous uncertainty as to how Greece and even more so how China’s stock market would play out. This fear and uncertainty sent the Dow Jones Industrial Average (chart) and the S&P 500 (chart)  tumbling down toward and below their 200-day moving averages. It really only took a day for this key support metric to kick in and demonstrate its technical support influence. Since this brief but noticeable selloff occurred, both indices have snapped back and we now find the S&P 500 (chart) within 10 points of its all-time high. Some pundits did indeed expect that Q2 earning reporting season could be the catalyst to lift the markets out of the fears of Greece and China. And seemingly their expectations have been met. That said, there are many more companies set to report their earnings results over the next couple of weeks, with all eyes now focusing on how Apple (NasdaqGS: AAPL) will fare as they are set to report their quarterly report next Tuesday July 21st after the close. As with most earnings reporting seasons over the past few years, stocks have overall fared well and this time it appears well enough to break key index records.

Good luck to all 🙂

~George

Tough Day For Stocks…

Stocks took it on the chin today with most of the major averages closing in the red. On the day, the Dow Jones Industrial Average (chart) closed down 279.47 points, the Nasdaq (chart) closed lower by 75.97 points, the S&P 500 (chart) closed the day off by 23.81 points and the small-cap Russell 2000 (chart) lost 21.04 points. Fears from Asia to Europe are spilling over in to U.S. Equities. Securities regulators in China are banning certain types of equities financing which will have an effect on margin trading. Furthermore, across the pond in Europe, investors are becoming more worried about Greece and whether or not that country will be able to make payments on debts that are coming due and whether or not Greece will even stay in the eurozone.

Despite today’s selloff, Q1 earnings have not been too shabby so far, especially out of the banking sector. Earlier this week, JP Morgan (NYSE: JPM) reported a $5.91 billion dollar profit or $1.45 per share surpassing most analysts expectations and Citigroup (NYSE: C) also exceeded analysts expectations by posting a $1.51 per share in earnings compared to the $1.39 per share the street expected. The stock that caught everyones attention this week was Netflix (NasdaqGS: NFLX). Netflix (chart) reported in their earnings release that almost 5 million subscribers came online compared to the 4 million analysts anticipated. This metric alone gave Netflix’s stock a boost of almost $90 dollar a share yesterday.

Fast forward to next week and we will get earnings results out of Morgan Stanley (NYSE: MS), Verizon (NYSE:V), United Technologies Corp (NYSE: UTX), Yahoo (NasdaqGS: YHOO), Boeing (NYSE: BA), eBay (NasdaqGS: EBAY), Facebook (NasdaqGS: FB), Qualcomm (NasdaqGS: QCOM), The Coca-Cola Co (NYSE: KO), Tractor Supply Co. (NasdaqGS: TSCO), 3M Co (NYSE: MMM), Amazon (NasdaqGS: AMZN), Eli Lilly & Co. (NYSE: LLY), General Motors (NYSE: GM), Google (NasdaqGS: GOOGL), Microsoft (NasdaqGS: MSFT), Newmont Mining (NYSE: NEM), Southwest Airlines (NYSE: LUV), Starbucks Corp (NasdaqGS: SBUX) and Biogen (NasdaqGS: BIIB) just to name a few. I think it’s safe to say we will get a very broad look as to how corporate America is faring after all of these earnings results come forward.

Have a great weekend and good luck next week 🙂

~George

A Ho Hum Q1…

It doesn’t seem like it, but for the first quarter of the year the four major averages were essentially flat. For the quarter, the Dow Jones Industrial Average (chart) closed basically unchanged, the tech heavy Nasdaq (chart) finished up just over 1% percent, the S&P 500 (chart) +2.2% and the small-cap Russell 2000 (chart) closed out Q1 slightly up. Quite an uneventful quarter at least from a P&L standpoint especially considering China’s economic slow down and the Ukraine crisis that unfolded in the quarter. There was a period in late January in which we saw a sharp 5% decline only to be met with unconditional support, followed by a rally which led the markets back to almost unchanged on the year.

As I always do at the end of each quarter, I look at the technical conditions of the aforementioned indexes and how they are shaping up going into a new quarter. There are plenty of market technicians out there that use a variety of techniques and indicators to identify trends and where the markets may be headed. My preference is to keep things as simple as possible when conducting technical analysis. As you may know by now, two of my favorite technical indicators are the  Relative Strength Index also know as the RSI and the moving averages. Part of the reason why I prefer these two reliable indicators over most is it is now seemingly more than ever computerized trading models are emphasizing the RSI and the 20-day, 50-day, 100 and 200-day moving averages in their models. These indicators also have been a long time favorite of institutional investors. So it’s no wonder that when the Relative Strength Index (RSI) is indicating an overbought or oversold condition in an index or equity, more times than not, the asset finds support and changes direction. The same can be said for the moving averages, whenever a stock or index bumps up against or comes down to its moving average, typically the stock or index finds support or resistance.

Let’s break this down in more detail starting with the (RSI), The RSI is designed to demonstrate whether or not an index or equity is overbought or oversold, depending on certain value levels. According to the RSI principle, the 70 value level or greater, is an overbought condition and the 30 value and below is an oversold condition. Looking at the aforementioned indices now, there is no indication of an overbought or over sold condition. However, both the Nasdaq (chart) and the small-cap Russell 2000 (chart) are trading and have closed below their 50-day moving averages. These two indices have been leading the markets higher and now comparatively speaking, they have begun to lag, a potential short term ominous sign. Now it has only been a couple of days that both of these indexes have been trading below this support line so we will have to wait and see if this turns into a longer term trend.

That said, we will not have to wait much longer. This Friday’s jobs report will shed light as to the health of the labor market and don’t look now but Q1 earnings reporting season is on deck. Without a doubt, Q1 earnings reporting season will be placed under a microscope to see if corporate America and the markets deserve their current valuations. Personally, I think a rather healthy pullback may be in the cards for equities and if so, most likely, the trend of unconditional support will come back into the markets as well.

Good luck to all. 🙂

~George

Global Concerns Give Markets A Pause…

Stocks had a very volatile week as tensions elevated in Ukraine and now China has seemingly hit a soft patch in its economy. For the week, the Dow Jones Industrial Average (chart) fell 2..35%, the Nasdaq (chart) gave back 2.09%, the S&P 500 (chart) -1.96% and the small-cap Russell 2000 (chart) ended the week lower by 1.82%. I do not think the most recent retreat in stocks is anything beyond the current global headline risks as our own economy appears to be intact and growing, albeit modestly. Some economists believe China will maintain a 7.5% growth rate this year while other pundits believe a cooling off of China’s economy would affect our markets here. Should the latter be the case, I would assume the Chinese government would take measures to help prop up their economy by injecting enough stimulus to ensure the targeted 7.5% growth rate for 2014 would not be breached. Recently, the economic numbers across the board coming out of China has been weaker than expected, especially in the manufacturing and export sectors.

This past week also saw an escalation in the crisis in Ukraine with both sides increasing the chatter about a potential military conflict as protests have become extremely violent. Governments from around the world are now are attempting to assist in the negotiations with Russia and Ukraine to formalize some type of accord. So it’s no surprise that a “risk off” mentality has come into the markets for the time being. I do believe that once things settle down in the Ukraine and the China headlines become less frequent, we could consolidate here for a bit as the first quarter of the year winds down. Then of course as we enter into April, all eyes will be watching how corporate America fared during the first quarter as Q1 earnings reporting season will begin. Between now and the end of March, I will be paying closer attention to our own economic data which will most likely translate into companies Q1 earnings reports.

Technically speaking, the Dow Jones Industrial Average (chart), the Nasdaq (chart), the S&P 500 (chart) and the Russell 2000 (chart) all appear to be heading towards their respective 50-day moving averages, in fact the Dow (chart)  actually breached its 50-day on Friday. The 50-day moving average is a technical indicator I favor as do other certain market technicians. Historically, when stocks or indexes reach their 50-day or 200-day moving average for that matter, support is typically found and a reversal of the stock or index ensues. The moving averages are also followed by certain institutional investors and select computerized algorithmic trading models, which could also be a reason why the moving averages can act as a support mechanism. Now I am not suggesting that the moving averages are infallible, I personally utilize this indicator mainly from a technical standpoint to help me navigate current market opportunities. Good luck to all.

Have a great weekend 🙂

~George


Gold gets pummeled!

The price of gold fell below $1,400 an ounce for the first time in over two years. In fact, gold and silver both have lost over 10% of its value in the past two trading sessions. Panic selling has set in with not only key technical support levels being shattered, but fears that Cypress and other European countries may have to sell their gold reserves in order to generate liquidity. In addition, slower than expected Q1 growth out of China also added to the panic selling. This capitulation type selling has spilled over to the majority of the gold miners with the gold miners ETF (Symbol: GDX) chart losing over 20% of its value over the past couple of trading sessions. Folks this type of panic selling is what can happen once technicals and fundamentals breakdown and fear takes over. In looking at the most popular ETF that tracks the price of gold (Symbol: GLD) chart, it appears that a multi-year support zone could be found in the $128.00 area which is now only a few dollars away. However, when you have panic selling, margin call selling, institutional and hedge fund selling, all bets are off pertaining to technicals until the smoke clears and cooler heads prevail.

As far as the equities markets are concerned, this is a big week for Q1 earnings reports. We will hear from the likes of Coca-Cola (NYSE: KO), Goldman Sachs (NYSE: GS), Johnson & Johnson (NYSE: JNJ), Intel (NasdaqGS: INTC) Yahoo (NasdaqGS: YHOO), Bank of America (NYSE: BAC), American Express (NYSE: AXP) and Ebay (NasdaqGS: EBAY) just to name a few.

Good luck to all and have a great week 🙂

~George