Dow 22,000 In Sight…

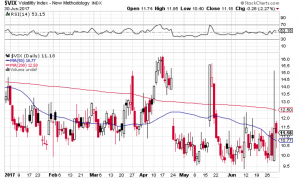
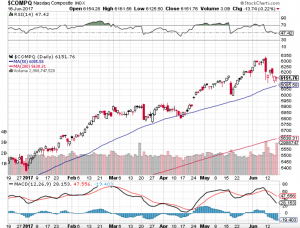
The Dow Jones Industrial Average (chart) closed the month of July at a record high and came within 70 points of the 22,000 mark. Just a few short months ago that the Dow surpassed the 21,000 milestone. What an incredible run in such a short period of time! Not only is the Dow Jones Industrial Average (chart) notching new record highs almost daily, the Nasdaq (chart) last Thursday posted a new record at 6460, as did the S&P 500 (chart) setting a new record of 2484. Last but not least, the small-cap Russell 2000 (chart) also set a new record last week of 1452. However, both the Nasdaq (chart) and the small-cap Russell 2000 (chart) have reversed their upward trajectory over the last few trading sessions in a noticeable manner. Let’s keep an eye on this development.

I think it is safe to say that Q2 earnings reporting season has helped fuel the Dow Jones to new record highs as well as the S&P 500. Tech stocks have been reporting a mixed bag so far this earnings reporting season which is why that index has started to abate a bit. All eyes today are on Apple (NasdaqGS: AAPL) which report their earnings results after the close. This could be the one stock that either reverses the latest mini-downward trend in the Nasdaq or for that matter, accelerate it. As I look to the technical shape of the the aforementioned indexes, only the Dow Jones Industrial Average (chart) is on overbought territory, while the S&P 500 (chart), Nasdaq (chart) and the small-cap Russell 2000 (chart) have begun their reversion to the mean and are all approaching the 50 value level of the relative strength index.

Game plan for August? Personally, I think it is time to reduce long exposure to equities due in part to this startling run stocks have had all year long. This coupled with the month of August being an historically weak month for equities could create the perfect set up for the much anticipated market correction that the bears have been waiting on. That said, I have to remind myself that there has been no such thing as typical in these markets for we have been in unchartered territory for a long period of time. One final note, it is always recommended to consult with a certified financial planner before making any adjustments to your portfolio.

Good luck to all 🙂

~George


Record After Record!

Another week in the books and records continue to fall. The Dow Jones Industrial Average (chart) and the S&P 500 (chart) both closed the week at record highs, while the Nasdaq (chart) and the small-cap Russell 2000 (chart) are within a stones throw from their all-time highs. These key indices have been setting records all year long. With the exception of a few minor pullbacks throughout the year, stocks have pretty much gone up in a straight line. This despite a very tepid economic recovery here in the United States with the GDP coming in at a modest increase of 1.4%.

I think it is safe to say that this latest record setting week was due in part to Federal Reserve Chairman Janet Yellen’s dovish comments regarding interest rates and that the Fed would be very gradual in its future hikes and that such action will be determined by how well the economy fares. If the latest retail sales numbers and consumer price index number are indicative of what the Fed will do, we may not see another hike until year end or even 2018? This is just what the markets needed in order to keep a floor not only under the stocks, but the confidence to proceed as business as usual hence record setting highs.

Well the old adage of you can’t fight the tape or the Fed for that matter is certainly playing out so far in 2017. Are there any catalysts out there that could change the markets mind or its direction? Well we are about to enter the busiest week of Q2 earnings reporting season so far with over 440 companies reporting their results next week including the likes of Netflix (NasdaqGS: NFLX), Goldman Sachs (NYSE:GS), International Business Machine (NYSE: IBM), Johnson & Johnson (NYSE: JNJ), United Airlines (NYSE: UAL), American Express (NYSE: AXP), eBAY INC. (NasdaqGS: EBAY) and General Electric (NYSE: GE) just to name a few. The following week over 1400 companies will report their quarterly results. So if there is anything that could slow this bull market down right now this is it. However, if corporate America continues to report solid earnings results, new record highs could very well continue into the foreseeable future. Good luck to all 🙂

~George


Where Is The Vol?

As the second quarter came to a close yesterday volatility is no where to be found. The CBOE Market Volatility Index also referred to as the VIX has been pretty much dormant this entire year (chart). Typically vol ticks up as we approach summer for a variety of reasons such as earnings reporting season, seasonality and of course the Federal Reserve policy actions. As expected the Fed did raise rates in June but the markets appear to be pricing in a higher interest rate environment. So far this year the Dow Jones Industrial Average (chart) is up 8.03%, the S&P 500 (chart) is up 8.24%, the Nasdaq Composite (chart) is up a whopping 14% and the small-cap Russell 2000 (chart) is up a modest 4.29%.

Seemingly everyday stocks are in melt-up mode. There are days where volatility tries to rear its head up, but that does not last very long. (See chart below). Even when Goldman Sachs came out with a bearish report on June 9th comparing the red-hot tech sector to the internet bubble era, the negative effect of that report lasted only a couple of days before tech found support and then proceeded to make new highs. The traders and investors that are waiting for the proverbial 10% or more correction are just not getting it. Buying the pullbacks is what has been working ever since the election but the problem is that if you are not stepping in on the 1-3% percent retracements, you are missing the next leg up. How much longer can this type of market environment last? Now that Q2 is in the books, earnings reporting season will soon begin. Let’s see if corporate earnings continue to come in stronger than analyst expectations and if so, stocks may just continue to remain bulletproof.

A quick gander at the technical shape of the aforementioned indexes and there are no signs of overbought or oversold conditions according the relative strength index. Therefore I am expecting vol to remain relatively low until at least second quarter earnings season begins. Good luck to all!

Both Paula and I wish everyone a very safe and happy Fourth of July holiday weekend 🙂

~George

VIX Chart - Paula Mahfouz

Tech Stocks Hit The Brakes!

After going up in a straight line for months, the technology sector (see chart below) has reversed its upward course. After hitting an all-time high of 6341.70 on June 9th, the Nasdaq (chart) has given back 190 points or three percent while approaching its 50-day moving average. Nowadays it’s pretty rare to see a one percent pullback in tech stocks let alone a three percent retracement in a week. The media is now all over how tech stocks today are beginning to resemble the internet bubble. The difference between today and yesteryear is that the top five tech stocks – Amazon (NasdaqGC: AMZN), Apple (NasdaqGC: AAPL), Facebook (NasdaqGS: FB) Google’s parent company Alphabet (NasdaqGC: GOOGL) and Microsoft (NasdaqGC: MSFT) have been responsible for a big chunk of the Nasdaq and S&P 500 (chart) recent gains. The problem with comparing today’s market with the internet bubble is that the aforementioned tech leaders all have incredible balance sheets while continuing to grow at a pace that supports their relative stock prices. One may argue that Amazon remains overpriced especially with its lofty P/E ratio.

It’s hard to imagine that anyone would be concerned about a three percent pullback in any stock or index, but because of how strong stocks have been since the election, anything other than a flat to up day will get noticed. That said, without question all eyes will be on whether or not the Nasdaq’s 50-day moving average will get tested. The last time the Nasdaq (chart) did not hold its 50-day support line was last October. Since then tech stocks have tested and moved off of its 50-day average multiple times. 6085 is the current the 50-day moving average of the Nasdaq which is about 65 points away. I am not suggesting it will go there, but if it does and according to the way tech stocks have reacted to that particular support line, a bounce could be in the cards. Good luck to all 🙂

~George

Nasdaq chart - George Mahfouz Jr

Are Energy Stocks And Banks Cracking?

As technology stocks continue to tick up to new record highs, banks and even more so energy stocks are showing signs of weakness. Yesterday, the Nasdaq (chart) hit an all time high of 6221.99 and the S&P 500 (chart) also notched a record recently at 2418.71. That said, the energy sector has lost almost 10 percent in the last month or so and the banking sector is beginning to technically breakdown. A very noticeable divergence is happening here and I think it is time to pay attention to this recent dynamic. The Dow Jones Industrial Average (chart) remains above 21000 and the small-cap Russell 2000 (chart) is seeking direction.

I am not surprised that certain sectors of the market are showing weakness which is only normal with the tremendous run the markets have had since the election, however, it is the sectors that are breaking down that is a bit alarming to me. One has to ask is the price action in oil and energy stocks indicative of weakening demand hence a weakening economy? Or is this just a matter of too much supply in oil regardless of the O.P.E.C. commitment to its production cuts. As far as the banks are concerned, one would also think with the Federal Reserve raising interest rates at their upcoming meeting in June and committing to additional rate hikes this year. that this would be bullish for bank stocks. Not the case recently. I am a little perplexed to the way the tape has been acting as of late especially pertaining to the aforementioned sectors.

The technical shape of the key indices appear to be intact with the exception of the small-cap Russell 2000. The Dow Jones Industrial Average (chart) is trading well above its 50-day moving average, along with the S&P 500 (chart)  trading near all-time highs and the Nasdaq (chart) as mentioned above hit an all-time high yesterday. However, the small-cap Russell 2000 (chart) is trading below its 50-day moving average and has been challenging certain support zones lately. This is yet another potential alarm along with the energy and banking sector weakness lately. So I would not be surprised to see the selling pressure in these particular sectors continue in the month of June which is historically one of the weakest month of the year for stocks. Good luck to all 🙂

~George

No Fear Here…

Despite North Korea launching its seventh missile test of the year on Sunday and the White House seemingly in an upheaval, stocks continue to demonstrate no fear and continue their record setting ways. Today the S&P 500 (chart) and the Nasdaq (chart) hit all time highs. Without question this bull market is now even catching wall street veterans off guard. Q1 earnings reporting season is close to wrapping up and other than retail, most companies have reported in-line or outright beats in their earnings results, especially the tech sector. Tech has been on fire lately and this is due in large part of mega-cap tech smashing analysts expectations. Earnings results from companies such as Apple (NasdaqGS: AAPL), Amazon (NasdaqGS: AMZN), Alphabet (NasdaqGS: GOOGL) and Facebook (NasdaqGS: FB) has propelled the Nasdaq (chart) and these particular issues to all-time highs. The Dow Jones Industrial Average (chart) and the Russell 2000 (chart) remain in striking distance of setting new records as well. It is truly remarkable how the markets have been able to weather the current political environment here in the U.S. and the geopolitical risks abroad.

From a technical perspective, the aforementioned key indices are in pretty good shape. The Nasdaq (chart) is the only one of the four that remains in overbought territory according to the relative strength index. All of these averages also remain above their respective 50-day and 200-day moving averages, yet another bullish sign. Volatility also remains at historic lows. So one may ask what about the “sell in May and go away” adage? From a technical standpoint, I do not see any reason why these markets won’t continue to melt up from here. Of course there is always the risk of a geopolitical event or the actual seasonal risk of assets taking a pause or retracing a bit. That said and whatever the case may be, it is undeniable that the markets have been the most resilient in years, if ever.

Good luck to all 🙂

~George

Geopolitical Risks Abound…

Stocks closed the shortened holiday week down on Thursday as the U.S. dropped the largest non-nuclear bomb on a target in Afghanistan. This just after the U.S. launched tomahawk missiles targeting a Syrian airbase in response to a chemical attack on innocent civilians in Syria. Now North Korea is increasing its verbal threats of an all out war on the United States. What’s going on here? It’s hard to talk about stocks when all of this hatred is occurring around the world. Nonetheless, the markets will move forward but will be certainly affected by the troubling geopolitical environment and the uncertainties that exist in multiple regions around the globe.

For the week, the Dow Jones Industrial Average (chart) closed down 1%, the S&P 500 (chart) closed off 1.19%, the Nasdaq (chart) -1.2% and the small-cap Russell 2000 (chart) finished the week lower by 1.39%. Gold (see chart below) was up on the week and for the first time since November of last year, closed above its 200-day moving average. This is no surprise due to what is currently going on in the world. The question now is how to trade this market environment or what to do with your current positions? If history repeats itself, market volatility should increase which is good for traders but can be unnerving to longer term investors. In fact volatility (chart) spiked this week to its highest level in 5 months.

Now that earnings reporting season is underway some market pundits are saying that this will dictate whether or not markets will continue higher or if earnings reporting season will be the catalyst to send stocks into correction mode. I disagree with this point of view. How can the markets concentrate on earnings reporting season when you have this widespread turmoil around the globe? Of course, earnings are what typically drive stocks and valuations but until the geopolitical back drop abates and a sense of resolve comes forward I will be ultra conservative in going long any equities unless it is gold or gold related assets. Of course it is always best to consult a certified financial planner(s) before making any investment decisions. Good luck to all and both Paula and I wish all a safe and Happy Easter weekend.

~George

gold chart george mahfouz jr

Solid Gains In Q1!

The major averages closed out the first quarter of the year posting solid results. The Dow Jones Industrial Average (chart) closed up 4.6%, the S&P 500 (chart) closed up 5.5%, the small-cap Russell 2000 (chart) gained 2.1% and the technology focused Nasdaq (chart) finished out the first quarter of the year up an eye-popping 10%. It’s no surprise how well tech did in Q1 considering how much this sector sold off after Trump won the election.

Although stocks continue to outperform, there has been some uncertainty coming into backdrop. The GOP’s inability to pass Trumpcare was the first sign of the potential breakdown of the new administration’s policies. Investors are beginning to wonder whether or not there will be more divide amongst republicans and how that could affect the upcoming tax reform bill. If there are any snags there or if that reform does not pass, some market pundits believe a 10-20% correction could occur.

Here are my thoughts about that. I do agree that if the proposed Trump tax reform does not go through, there indeed could be an immediate market reaction to the downside. How much, who knows? The markets are seemingly priced to perfection and then some. So if corporate tax rates are not reduced as Trump and his administration has outlined, why wouldn’t stocks be affected? Of course we will not know until late summer how the administration’s new tax policy will look like in its final state or whether or not it will even pass.

That said, there is plenty of runway between now and then for stocks and this starts with first quarter earnings reporting season. April is the month in which companies begin to report their earnings results to their shareholders. Corporate profits appear to be growing along with the economy. This my friends is where investors should be valuing stocks. So much emphasis has been put on the new administration’s economic and tax reform policies that we need not to forget about what really matters and that is corporate profits. That is not to say that government polices including the Federal Reserve don’t matter, but at the end of the day and when all the votes are in, growth and profits to me is what truly matters when valuing and investing in stocks.

Good luck to all 🙂

~George


Markets Cheer Fed Rate Hike!

As expected, the Federal Reserve raised short term interest rates by one quarter point and indicated that they will keep raising rates throughout the year albeit gradually. I do think what helped the markets yesterday was the language of only two more rate hikes this year. The economic data coming out so far is stronger than expected including the February jobs report which confirmed how the job market is continuing to expand and this had some pundits thinking three more rate hikes were in the cards for 2017, not just two. Markets rallied once again on the news and quite frankly the market is seemingly rallying on anything that hits the tape. That said, the Federal Reserve is doing a masterful job with how it is handling the change of guard so to speak from accommodation to raising rates and how they are communicating each message.

So what does this mean to the markets going forward? I gotta tell you as much as I have been expecting volatility to increase, my expectations now are as long as the Fed remains in its current position, volatility may just stay in hibernation until further notice. I have not seen a market to where vol has been and remains this low. As I write this blog the CBOE Market Volatility Index also know as the VIX remains historically low and even when there is pressure on stocks, the VIX does not move very much, just look at the chart below.

Taking a look at the four major indices, The Dow Jones Industrial Average (chart), the S&P 500 (chart), the Nasdaq (chart) and the small-cap Russell 2000 (chart) all are within striking distance of their record highs. The question now becomes will valuations be able to support the continuation of this bull market or will this be the catalyst to bring pause into this historic bull run. We won’t have to wait too much longer as the first quarter of 2017 winds down and companies prepare to report their earnings results beginning in April. Paula and I wish everyone a very safe and Happy St. Patrick’s Day 🙂

~George

VIX chart - Paula Mahfouz