Tech Stocks Hit The Brakes!

After going up in a straight line for months, the technology sector (see chart below) has reversed its upward course. After hitting an all-time high of 6341.70 on June 9th, the Nasdaq (chart) has given back 190 points or three percent while approaching its 50-day moving average. Nowadays it’s pretty rare to see a one percent pullback in tech stocks let alone a three percent retracement in a week. The media is now all over how tech stocks today are beginning to resemble the internet bubble. The difference between today and yesteryear is that the top five tech stocks – Amazon (NasdaqGC: AMZN), Apple (NasdaqGC: AAPL), Facebook (NasdaqGS: FB) Google’s parent company Alphabet (NasdaqGC: GOOGL) and Microsoft (NasdaqGC: MSFT) have been responsible for a big chunk of the Nasdaq and S&P 500 (chart) recent gains. The problem with comparing today’s market with the internet bubble is that the aforementioned tech leaders all have incredible balance sheets while continuing to grow at a pace that supports their relative stock prices. One may argue that Amazon remains overpriced especially with its lofty P/E ratio.

It’s hard to imagine that anyone would be concerned about a three percent pullback in any stock or index, but because of how strong stocks have been since the election, anything other than a flat to up day will get noticed. That said, without question all eyes will be on whether or not the Nasdaq’s 50-day moving average will get tested. The last time the Nasdaq (chart) did not hold its 50-day support line was last October. Since then tech stocks have tested and moved off of its 50-day average multiple times. 6085 is the current the 50-day moving average of the Nasdaq which is about 65 points away. I am not suggesting it will go there, but if it does and according to the way tech stocks have reacted to that particular support line, a bounce could be in the cards. Good luck to all 🙂

~George
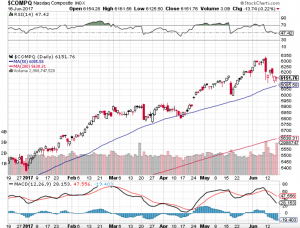
Nasdaq chart - George Mahfouz Jr

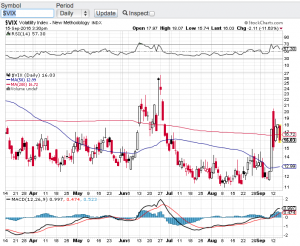
As Promised, Vol Is Back!

We knew it was only a matter of time. After trading in the most narrow range for the better part of the summer the VIX (see chart below) which is the ticker for the Chicago Board Options Exchange Volatility Index spiked this week over 60%!  This on fears that monetary policy changes are forthcoming here in the United States and abroad, especially as it pertains to interest rates. How is this a surprise though? There is not a day that goes by, in fact there is not an hour that goes by without headlines coming out pertaining to the Federal Reserve and what they will or will not do with interest rates.

Look my view is simple, count on it! Count on central banks changing their position on interest rates at some point in time. What amazes me is how much the markets and investors have become so reliant and seemingly make every investment decision based on whether interest rates remain near zero or begin to rise. How about this concept? Take a look at the premiums the markets have enjoyed over the past several years and minus that out. Then in my humble opinion we get back to fair value in stocks and markets. Although this has been one of the most profound bull markets in history, at some point in time equities are going to have to get off of the dependence on central bank accommodations. I look for ward to the day that we will be able to properly evaluate stocks and asset classes based on their respective fundamentals not on Federal Reserve policies.

Until then, the bulls can continue to enjoy the ride they have been on and I will continue to pay close attention to overbought and oversold conditions. With volatility back, this does create opportunity for the trader that is not too concerned with valuations. However, I expect that in the not so distant future, valuations will actually matter again. Good luck to all 🙂

~George

VIX chart George Mahfouz Jr