Dow 20,000!

There has been plenty of chatter over the past month or so as to whether or not the Dow Jones Industrial Average (chart) would surpass the 20,000 mark and what that would mean for the markets going forward. Well lo and behold, it did it! For the first time in its history, the Dow Jones Industrial Average (chart) breached the 20,000 milestone mark last week thanks in part to earnings reporting season. The Nasdaq (chart) also continues to set record highs although this week this particular index has recently been challenged by Donald Trump’s commitment to altering the H-1B visa rules which in turn could effect the tech industry in a meaningful way. The S&P 500 (chart) also remains near its all-time highs while the small-cap Russell 2000 (chart) is hovering around its 50-day moving average.

While earnings reporting season remains a key focus for investors, one cannot ignore the constant daily flow of news out of Washington D.C. President Donald Trump like no other has signed double digit executive orders in his first week of office alone fulfilling part of his campaign pledges. These executive orders range from loosening regulations in a variety of industries, to border security, to withdrawing the United States from the Trans-Pacific Partnership Negotiations agreement and to the construction of the Keystone XL pipeline, just to name a few. Without question Donald Trump means business and is acting swiftly about it. We know how the American public feels about this and most recently how corporate America is beginning to speak out, and it’s a mixed bag to say the least.

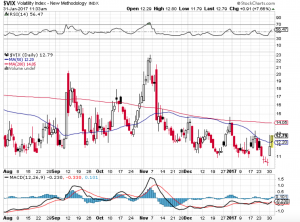
The question now is how will the markets ultimately react to the new norm, the protectionism posture of the new administration and the swift policy changes that are occurring? Well for the first time in a while market volatility (see chart below) has spiked as investors and traders alike try to digest the ultimate outcomes of such dramatic changes. In my humble opinion, vol is just getting started. Good luck to all 🙂

~George
Dow 20,000 George Mahfouz Jr

Quietly The VIX Elevates…

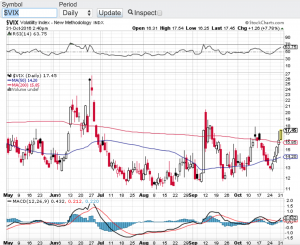
Over the past week the CBOE Market Volatility Index aka the VIX (see chart below) has risen over 35%. Not too surprising considering the upcoming elections and the daily rhetoric that has been hitting the wires. What is surprising to me is that even though volatility has spiked recently, the markets have not really dropped. Isn’t how this is supposed to work? Increase in vol equals lower stock prices? The Dow Jones Industrial Average (chart), the S&P 500 (chart) and the Nasdaq (chart) all remain within striking distance of all-time highs and so far these key indices do not seem to be too bothered by the daily political headlines. Even Friday’s surprising if not shocking news that F.B.I. director James Comey has re-opened the Hillary Clinton email case could not rattle the markets. Although this particular headline did send stocks sharply lower in the late afternoon trading on Friday only to find support and close off of the lows.

I will say this; I am even more surprised that yesterday we did not see a sell-off in stocks after everyone had time to digest the news over the weekend. Stock market pundits continue to claim that the markets have priced in a Clinton victory and that her taking the White House in general will be bullish for stocks. I tend to agree with this however; my concern is will this be a “sell the news” event? I will also be paying closer attention to the polls this week to see if the Trump campaign closes in on the Clinton lead. This too can be a market moving dynamic. So as the VIX continues to lift and as we get closer to November 8th, I will error on the side of caution and lighten up any long positions and wait to see how this election plays out. Let’s also see how the markets react and respond to the election results and then come up with a game plan into year-end. Good luck to all 🙂

~George

VIX chart George Mahfouz Jr

As Promised, Vol Is Back!

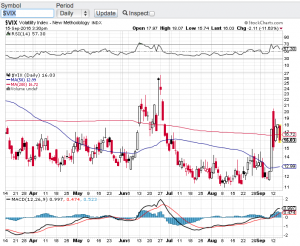
We knew it was only a matter of time. After trading in the most narrow range for the better part of the summer the VIX (see chart below) which is the ticker for the Chicago Board Options Exchange Volatility Index spiked this week over 60%!  This on fears that monetary policy changes are forthcoming here in the United States and abroad, especially as it pertains to interest rates. How is this a surprise though? There is not a day that goes by, in fact there is not an hour that goes by without headlines coming out pertaining to the Federal Reserve and what they will or will not do with interest rates.

Look my view is simple, count on it! Count on central banks changing their position on interest rates at some point in time. What amazes me is how much the markets and investors have become so reliant and seemingly make every investment decision based on whether interest rates remain near zero or begin to rise. How about this concept? Take a look at the premiums the markets have enjoyed over the past several years and minus that out. Then in my humble opinion we get back to fair value in stocks and markets. Although this has been one of the most profound bull markets in history, at some point in time equities are going to have to get off of the dependence on central bank accommodations. I look for ward to the day that we will be able to properly evaluate stocks and asset classes based on their respective fundamentals not on Federal Reserve policies.

Until then, the bulls can continue to enjoy the ride they have been on and I will continue to pay close attention to overbought and oversold conditions. With volatility back, this does create opportunity for the trader that is not too concerned with valuations. However, I expect that in the not so distant future, valuations will actually matter again. Good luck to all 🙂

~George

VIX chart George Mahfouz Jr

Volatility Wakes Up!

After weeks of tepid volatility (chart)  investors and markets appear a bit jittery with volatility waking up. For the week, the Dow Jones Industrial Average (chart) closed down 1.3%, the tech-focused Nasdaq (chart) closed off 2.7%, the S&P 500 (chart) closed lower by 1.3% and the small-cap Russell 2000 (chart) finished lower on the week by 1.4%. As first quarter earnings reporting season begins to wind down with overall results coming in mixed, we now enter a time of year where weakness in stocks can occur with volatility even more prevalent. The old adage “sell in May and go away” could come into play.

The currents risks to the market as I see it is the market itself as valuations are historically high with the S&P 500 price to earnings ratio trading in the 20’s. Another risk to stocks is the possibility of the Fed raising rates in June.  These catalysts alone could be all that it takes for equities to not only pause but to continue to experience increased volatility as we head into the summer months. So now let’s look at the technical shape of the aforementioned indexes. After trading near or in overbought territory for the past month or so the Dow Jones Industrial Average (chart) broke through its 20-day moving average, the S&P 500 (chart) also broke through its 20-day moving average, however, a bit more troublesome is the Nasdaq (chart)  as it has broke through its 200-day moving average this past week, a moving average that is more closely watched. Finally, the small-cap Russell 2000 (chart) is now sitting right at its 20-day and 200-day moving averages. So the technical shape of the markets at least according to moving averages support lines appear to be breaking down a bit.

So as we head into a typically softer time for equities that is May and June, and considering the current technical shape of the markets, both Paula and I feel it would be best to move to the sidelines and see if the current increase in volatility continues or if this is just a pause in the sharp rally we have seen since the middle of February.

Good luck to all 🙂

~George

Volatility Back In Vogue…

Since the start of the year there has been a very noticeable uptick in volatility in the marketplace. Twice over the past couple of months volatility has spike past the coveted 30 value level which is considered to be the level that demonstrates a large amount of investor uncertainty and/or fear. This you can see clearly in the chart of the Chicago Board Options Exchange Volatility Index, Symbol: VIX (chart)The VIX tracks the S&P 500 and calculates the next 30-day expectation of implied market volatility of a wide range of call and put options related to the S&P 500. Investors have not seen this type of volatility in quite some time and traders and short sellers have certainly taken advantage of it.

Let’s take a look at what the increase in vol has done to the major averages. Year to date the Dow Jones Industrial Average (chart) is down over five percent, the Nasdaq (chart) is lower by almost nine percent, the S&P (chart) is off by over five percent and the small-cap Russell 2000 (chart) is down almost nine percent on the year as well. That said, these key indices have bounced sharply off of their recent lows in mid-Feburary and crude oil (chart) has seemingly found a interim bottom around the $30 dollar level.

So now what? I am expecting volatility to continue throughout the month of March especially as we lead up into the upcoming Federal Reserve policy meeting March 15-16th. Most experts do not expect the Fed to raise interest rates at this meeting and furthermore not until the economic data consistently proves otherwise.  In fact, there are certain economists out there that think that the Federal Reserve is handcuffed for now and won’t raise rates until the fourth quarter because of the global turmoil that has surfaced this year especially in China and Europe. The current global equity sell-off is without question part of the reason for the increase in vol here in the United States. Whatever the case is, I will be listening to what tone and language Janet Yellen will use at her press conference post meeting to get a sense of what’s next for rates and how this will effect our markets.

Good luck to all 🙂

~George

Stocks Skittish Before The Fed Meeting…

Stocks have become hesitant as to which direction to head into with all eyes now on whether the Federal Reserve will raise interest rates this week for the first time in almost a decade. The Dow Jones Industrial Average (chart) started the week down 62.13, the Nasdaq Composite (chart) closed Monday’s session out down 16.58, the S&P 500 (chart) fell 8 points and the small-cap Russell 2000 (chart) closed modest lower by 4.3 points.

As investors and traders await the decision from the Federal Reserve as to whether or not a rate increase will occur, I think the markets are putting too much emphasis on the initial hike, regardless if it’s announced after the conclusion of their two-day meeting this week. To me what’s more is how will the Federal Reserve respond over the coming months and quarters ahead? Shouldn’t we be more attuned to their behavior pattern after the first hike? Or whether or not they will raise rates at an accelerated rate? To me this is the bigger question. Of course a quarter point rate hike or even a 50 basis point hike is in the cards and is inevitable at some point in time, whether it’s this week or at the Federal Reserve’s future meetings. My focus and attention will be on how they treat the interest rate environment after the first rate hike actually occurs. Based on the temperament and demeanor of Janet Yellen, I would expect a continuing cautious protocol from our Fed Chair and I would think that neither she or the Fed would not be inclined to raise rates too fast. I would think the economic data would dictate the velocity of future rate hikes and even if the data becomes robust, the Federal Reserve would want to see multiple quarters of meaningful expansion before we get back to normalized rates.

That said, I do think that the markets and investors are going to need to get used to increased volatility and market swings similar to what we have been experiencing over the past few months. I believe gone are the days of low vol and indeed investors are going to need to pay attention now more than ever to the true growth rates of companies, especially on the top-line. You see in a rising interest rate environment companies can no longer grow their bottom line alone while maintaining high valuations. Real growth needs to come forward in the form actual sales expansion in addition to productivity in order for companies to maintain elevated P/E multiples. Bottom line, you better know the companies you choose to invest in because the free lunch so to speak that the markets, investors and traders have enjoyed over the past several years may come to a close in the near future…

Good luck to all 🙂

~George

Stocks Go On A Bumpy Ride…

The stock market ended the week eking out slight gains. For the week, the Dow Jones Industrial Average (chart) closed higher by 0.6%, the Nasdaq (chart) barely closed in the green on the week, the S&P 500 (chart) closed up 0.7% and the small-cap Russell 2000 (chart) finished the week up one half of one percent. I guess this could be viewed as a big win for the key indices considering how light crude oil (chart) has plummeted recently which directly correlates to the energy industry as a whole. Energy stocks have also gotten crushed along with oil which is why I think it’s rather impressive that aforementioned indexes were able to end the week in positive territory. However, volatility (chart) is continuing to spike and the 200-day moving average on the S&P 500 (chart) continues to get challenged. Some pundits believe that it’s only a matter of time that the 200-day on the S&P (chart) will not hold much longer, however, if you look back, no one can deny how this technical metric has been a pillar of support for this most watched index.

So what does an investor or trader do in this historically weak month for stocks and with volatility spiking now weekly? For me personally, I am not as active in the markets due the volatility spikes and typically lower volumes associated with the summer month of August. I prefer to spend my time in research identifying opportunities in the marketplace. For instance, watching the oil markets unravel the way that they have, without question opportunities are forthcoming in this space. The majority of individual energy stocks do indeed trade with the price of oil (chart) and to predict when the price of oil will stabilize is almost impossible. However, at some point in time oil will indeed stabilize and a plethora of opportunity will surface. If you do not want to take the risk on individual names, you can always consider the most popular ETF that tracks the energy space (symbol: XLE). This equity energy fund has an approximate $11.69 billion in net assets with holdings in some of the largest and most respected energy companies in the world. Of course and as I always recommend, it is always best practice to consult with a certified financial planner(s) that you feel comfortable and confident with before making any investment decisions. Good luck to all 🙂

~George

Despite A Pop In Volatility, Bull Market Remains Intact!

In the month of July, the major averages continued to demonstrate what a bull market looks like despite an increase in volatility $VIX (chart )and global macro concerns. For the month, the Dow Jones Industrial Average (chart) closed up a modest 0.40%, the Nasdaq (chart) gained 2.8% in July, the S&P 500 (chart) advanced 2.0% and the small-cap Russell 2000 (chart) actually ticked down on the month giving up 1.28%. One interesting note and if you look at the charts of the above mentioned indices, in the month of July each of these indexes breached their 200-day moving average and three of the four breached this support line twice only to rebound sharply and keep the technical makeup of the markets intact. Without question and throughout this six year long bull run, the technicals of stocks and indexes have done their job and has acted as technicians would expect.

Fast forward to today August 1st and if you have been on Wall Street long enough, yes we are now entering the dog days of summer. As Q2 earnings reporting season works its way through and begins to wind down, I would expect volatility also begin to abate as it has towards the latter part of this past week. Without question these markets could still react to China’s extreme volatility as of late or if there is a big surprise in next week’s job’s report, however, without any big surprise here or overseas, I think this becomes a stock-pickers market as well as a technically traded market paying attention to trend lines and overbought and oversold conditions. This could also be the perfect environment to sell put option premium on your most favorite stocks in order to generate some additional income. One other option which may be a very valid one, and that is turn off your screens and head to the beach until after Labor Day :-).

Whatever you choose to do as we enter the “dogs days of summer” it is always best practice to consult with a certified financial planner(s) before making any investment decisions or changes to your portfolio. Good luck to all 🙂

~George

Stocks Go On A Wild Ride!

As the new year begins to unfold, volatility has taken command! Yesterday, the Dow Jones Industrial Average (chart) had a 424 point intraday swing, an intraday move not seen in quite sometime. Volatility continued to surge this morning as stocks opened down sharply by weaker than expected retail sales for the month of December, and JP Morgan (NYSE: JPM) announcing weaker than expected quarterly results. So is this the new norm? Investors and especially traders have been waiting a long time to see volatility come back into the market and they may have just gotten what they have been expecting. For years, stocks have been in a low vol environment thanks in part to the Federal Reserve’s easy monetary policies. Now that those policies have and are winding down, it’s no surprise to me that volatility has picked up. Furthermore, now that we are have entered into Q4 earnings reporting season, I expect that volatility will remain elevated and possibly increase.

Companies that are scheduled to report their earnings results are over the next week are; Citigroup (NYSE: C), Intel (NasdaqGS: INTC), Goldman Sachs (NYSE: GS), Delta Airlines (NYSE: DAL), International Business Machines (NYSE: IBM), Morgan Stanley (NYSE: MS), Netflix (NasdaqGS: NFLX), American Express (NYSE: AXP), eBay Inc. (NasdaqGS: EBAY), Starbucks (NasdaqGS: SBUX), Verizon Communications (NYSE: VZ), General Electric (NYSE: GE), Honeywell International ( NYSE: HON) and McDonald’s Corp (NYSE: MCD) just to name a few.

More now than ever I will be focusing on “top-line” growth of corporate America to see if this most recent sell-off poses a buying opportunity. If the top-line of companies do not begin to grow in a meaningful way, I would expect the selling pressure to continue. Good luck to all 🙂

~George

OPEC Doesn’t Budge, Oil And The Energy Sector Tumble!

The Organization of the Petroleum Exporting Countries decided on Thursday not to cut production as many had hoped. This decision sent crude oil and energy stocks tumbling. The overall energy sector fell over six percent on Friday while U.S. crude fell to $66.36 per barrel, a level not seen in over four years. On the bright side however, lower oil prices will ultimately pass through to the consumer, which should be a positive for the overall economy. This may be the reason why the markets in general didn’t see too much pressure last week. For the week, the Dow Jones Industrial Average (chart), the S&P 500 (chart), and the small-cap Russell 2000 (chart) closed essentially unchanged, while the Nasdaq (chart) posted a strong weekly gain of 1.7%.

Friday’s trading session closed early due to the Thanksgiving holiday, so I will be very interested to see how crude oil and the energy sector trades this week as market participants get back to work and normal volumes resume. That said, I am expecting more downward pressure on oil and energy stocks in the near term. Without question the smaller, leveraged and debt-ridden oil and gas companies are in a precarious position, especially those in the exploration stages. These companies may be forced into consolidation or have no choice but to fire-sale part of their asset base in order to reduce debt levels. What I will be looking for in the coming weeks are large and mega-cap energy companies that have had their stock hit, and that have rock solid balance sheets that can weather the storm in this environment.

Despite the volatility the markets have experienced here in the fourth quarter and with crude oil falling sharply, three of the four major averages are still up impressively on the year, with the small-cap Russell 2000 (chart) basically flat. Now that we are in the month of December, I do not see any real headwinds as we close out 2014. In fact, with lower oil, the consumer may be a bit more cheerful as the Christmas holiday season fast approaches. If this is the case, stocks as a whole could end the year on their highs. Have a great week 🙂

~George