No Fear Here…

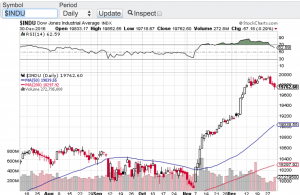
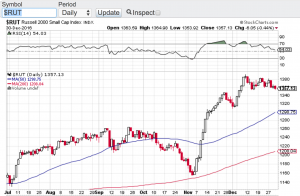
Despite North Korea launching its seventh missile test of the year on Sunday and the White House seemingly in an upheaval, stocks continue to demonstrate no fear and continue their record setting ways. Today the S&P 500 (chart) and the Nasdaq (chart) hit all time highs. Without question this bull market is now even catching wall street veterans off guard. Q1 earnings reporting season is close to wrapping up and other than retail, most companies have reported in-line or outright beats in their earnings results, especially the tech sector. Tech has been on fire lately and this is due in large part of mega-cap tech smashing analysts expectations. Earnings results from companies such as Apple (NasdaqGS: AAPL), Amazon (NasdaqGS: AMZN), Alphabet (NasdaqGS: GOOGL) and Facebook (NasdaqGS: FB) has propelled the Nasdaq (chart) and these particular issues to all-time highs. The Dow Jones Industrial Average (chart) and the Russell 2000 (chart) remain in striking distance of setting new records as well. It is truly remarkable how the markets have been able to weather the current political environment here in the U.S. and the geopolitical risks abroad.

From a technical perspective, the aforementioned key indices are in pretty good shape. The Nasdaq (chart) is the only one of the four that remains in overbought territory according to the relative strength index. All of these averages also remain above their respective 50-day and 200-day moving averages, yet another bullish sign. Volatility also remains at historic lows. So one may ask what about the “sell in May and go away” adage? From a technical standpoint, I do not see any reason why these markets won’t continue to melt up from here. Of course there is always the risk of a geopolitical event or the actual seasonal risk of assets taking a pause or retracing a bit. That said and whatever the case may be, it is undeniable that the markets have been the most resilient in years, if ever.

Good luck to all 🙂

~George

Geopolitical Risks Abound…

Stocks closed the shortened holiday week down on Thursday as the U.S. dropped the largest non-nuclear bomb on a target in Afghanistan. This just after the U.S. launched tomahawk missiles targeting a Syrian airbase in response to a chemical attack on innocent civilians in Syria. Now North Korea is increasing its verbal threats of an all out war on the United States. What’s going on here? It’s hard to talk about stocks when all of this hatred is occurring around the world. Nonetheless, the markets will move forward but will be certainly affected by the troubling geopolitical environment and the uncertainties that exist in multiple regions around the globe.

For the week, the Dow Jones Industrial Average (chart) closed down 1%, the S&P 500 (chart) closed off 1.19%, the Nasdaq (chart) -1.2% and the small-cap Russell 2000 (chart) finished the week lower by 1.39%. Gold (see chart below) was up on the week and for the first time since November of last year, closed above its 200-day moving average. This is no surprise due to what is currently going on in the world. The question now is how to trade this market environment or what to do with your current positions? If history repeats itself, market volatility should increase which is good for traders but can be unnerving to longer term investors. In fact volatility (chart) spiked this week to its highest level in 5 months.

Now that earnings reporting season is underway some market pundits are saying that this will dictate whether or not markets will continue higher or if earnings reporting season will be the catalyst to send stocks into correction mode. I disagree with this point of view. How can the markets concentrate on earnings reporting season when you have this widespread turmoil around the globe? Of course, earnings are what typically drive stocks and valuations but until the geopolitical back drop abates and a sense of resolve comes forward I will be ultra conservative in going long any equities unless it is gold or gold related assets. Of course it is always best to consult a certified financial planner(s) before making any investment decisions. Good luck to all and both Paula and I wish all a safe and Happy Easter weekend.

~George

gold chart george mahfouz jr

Markets Cheer Fed Rate Hike!

As expected, the Federal Reserve raised short term interest rates by one quarter point and indicated that they will keep raising rates throughout the year albeit gradually. I do think what helped the markets yesterday was the language of only two more rate hikes this year. The economic data coming out so far is stronger than expected including the February jobs report which confirmed how the job market is continuing to expand and this had some pundits thinking three more rate hikes were in the cards for 2017, not just two. Markets rallied once again on the news and quite frankly the market is seemingly rallying on anything that hits the tape. That said, the Federal Reserve is doing a masterful job with how it is handling the change of guard so to speak from accommodation to raising rates and how they are communicating each message.

So what does this mean to the markets going forward? I gotta tell you as much as I have been expecting volatility to increase, my expectations now are as long as the Fed remains in its current position, volatility may just stay in hibernation until further notice. I have not seen a market to where vol has been and remains this low. As I write this blog the CBOE Market Volatility Index also know as the VIX remains historically low and even when there is pressure on stocks, the VIX does not move very much, just look at the chart below.

Taking a look at the four major indices, The Dow Jones Industrial Average (chart), the S&P 500 (chart), the Nasdaq (chart) and the small-cap Russell 2000 (chart) all are within striking distance of their record highs. The question now becomes will valuations be able to support the continuation of this bull market or will this be the catalyst to bring pause into this historic bull run. We won’t have to wait too much longer as the first quarter of 2017 winds down and companies prepare to report their earnings results beginning in April. Paula and I wish everyone a very safe and Happy St. Patrick’s Day 🙂

~George

VIX chart - Paula Mahfouz


Dow 21,000 Are You Kidding?

This market is unbelievable! As I am writing this blog the Dow Jones Industrial Average (chart) has eclipsed the 21,000 mark. This after President Donald Trump’s first speech to the joint session of Congress. Not only has the Dow breached 21,000, the Nasdaq (chart) has also set a new record this morning at 5,875, the S&P 500 (chart) has set a new record of 2,384 and counting, the small-cap Russell 2000 (chart) has hit a new record high and even the Dow Jones Transportation Average (chart) has set a new record high this morning at 9567.

It’s been exactly one month since the Dow Jones Industrial Average (chart) topped the 20,000 mark and now catapulting through 21,000! It’s inconceivable that the Dow has tacked on yet another 1,000 points in a month. The bears must be in shock! I am not exactly sure what President Trump said last night that is any different from what he has already promised during his campaign and during his inaugural speech in January. One would think that the markets have already priced in the “huge” corporate tax cuts Trump has promised. Also, I thought that the markets have also priced in the proposed $1 trillion dollar infrastructure spend. One thing for sure, right now the markets don’t care about valuations or the fact that it will take time for the Trump administration to figure out if the tax cuts or infrastructure spend as promised will even occur as designed?

I like to close my blogs out with the current technical take of the indexes. Quite honestly, the technicians are also baffled about this tape. The Dow Jones Industrial Average (chart) remains in extremely overbought conditions as does the S&P 500 (chart). The Nasdaq (chart) just re-entered overbought territory according to the relative strength index and the small-cap Russell 2000 (chart) is heading in that direction. We are witnessing one of the strongest bull markets in history!

Good luck to all 🙂

~George


Simply On Fire!

Stocks continue to set records and now on a daily basis! As I am writing this blog the Dow Jones Industrial Average (chart) is now trading north of 20440, the S&P 500 (chart) is trading well above 2300, the Nasdaq (chart) is trading above 5750 and the small-cap Russell 2000 (chart) set an all time high yesterday at 1398! I continue to be amazed on how resilient the markets have been and continue to be. Earlier this month it appeared that the Trump rally stalled out and it was becoming a wait and see environment. Well now the Trump rally has seemingly reignited. Trump last week announced he has major news forthcoming on his tax plan and that was apparently the cue for the markets to rally yet again. However, one has to ask how many more tweets, news conferences or headlines can take the markets higher? Without question the above key indices are becoming overbought and especially pertaining to the relative strength index also know as the RSI. Let’s take a look.

Currently the Dow Jones Industrial Average’s RSI (chart) is trading at a 73, the S&P 500 (chart) RSI is also currently at 73, the Nasdaq (chart) is even higher at 77. The only laggard pertaining to the relative strength index and being in an “overbought” condition is small-cap Russell 2000 (chart) in which its RSI is currently at the 60 value level. Remember the relative strength index is a widely utilized technical indicator that certain institutional traders include in their models along with a variety of algorithm trading platforms. The RSI is a momentum indicator that tracks the size of gains and losses over a given period of time with the 70 value level and above as overbought and the 30 value level and below as oversold. One of the concerns certain market technicians have is that these all time highs and overbought conditions have been occurring on relatively light volume. Without trying to call a top here, I suspect that the aforementioned indices and some of the overbought stocks within these indexes are due for a pullback.

Good luck to all and Paula and I wish everyone a Happy Valentine’s Day 🙂

~George


Dow 20,000!

There has been plenty of chatter over the past month or so as to whether or not the Dow Jones Industrial Average (chart) would surpass the 20,000 mark and what that would mean for the markets going forward. Well lo and behold, it did it! For the first time in its history, the Dow Jones Industrial Average (chart) breached the 20,000 milestone mark last week thanks in part to earnings reporting season. The Nasdaq (chart) also continues to set record highs although this week this particular index has recently been challenged by Donald Trump’s commitment to altering the H-1B visa rules which in turn could effect the tech industry in a meaningful way. The S&P 500 (chart) also remains near its all-time highs while the small-cap Russell 2000 (chart) is hovering around its 50-day moving average.

While earnings reporting season remains a key focus for investors, one cannot ignore the constant daily flow of news out of Washington D.C. President Donald Trump like no other has signed double digit executive orders in his first week of office alone fulfilling part of his campaign pledges. These executive orders range from loosening regulations in a variety of industries, to border security, to withdrawing the United States from the Trans-Pacific Partnership Negotiations agreement and to the construction of the Keystone XL pipeline, just to name a few. Without question Donald Trump means business and is acting swiftly about it. We know how the American public feels about this and most recently how corporate America is beginning to speak out, and it’s a mixed bag to say the least.

The question now is how will the markets ultimately react to the new norm, the protectionism posture of the new administration and the swift policy changes that are occurring? Well for the first time in a while market volatility (see chart below) has spiked as investors and traders alike try to digest the ultimate outcomes of such dramatic changes. In my humble opinion, vol is just getting started. Good luck to all 🙂

~George

Dow 20,000 George Mahfouz Jr

Earnings Take Center Stage…

Earnings reporting season begins in earnest this week which could play a role in determining whether or not the bull market has more room to run. This past Friday the money center banks kicked off the reporting season as JP Morgan Chase (NYSE: JPM) and Bank of America (NYSE: BAC) recorded eye popping profits while Wells Fargo (NYSE: WFC) continues to deal with the aftermath of the “fake-accounts” debacle that rocked the bank last year.

As I look at the charts of the key indexes, I do see a potential technical catalyst looming. The Dow Jones Industrial Average (chart), the S&P 500 (chart) and the small-cap Russell 2000 (chart) all share similar and current chart patterns. Over the past month or so, these key indices have been consolidating and trading in a tight range and when you have a looming catalyst such as earnings reporting season, most likely this pattern will breakout or breakdown. The Nasdaq (chart) does not fit this consolidation profile yet as it has been making new highs and leading the pack so far this year. Another technical set-up I look for is overbought or oversold conditions. Seemingly we have been in overbought conditions since the election but technically we are not according to the relative strength index also known as the RSI.

In my previous blog I did write about my expectation of increased volatility as we headed into January and earnings reporting season and how to hedge yourself against such volatility. To my surprise, vol has remained relatively low so far, however, there are catalysts looming as described above. As far as protecting a portfolio against any future volatility, there are many ways to do so but the most effective and simplest way is to buy S&P 500 puts. Especially while vol is low and premiums are relatively cheap. So if you have a “long only” portfolio buying some protection in the form of S&P 500 put options might not be a bad idea. Of course it is always best to consult a certified financial planner(s) before making any investment decisions or any adjustments to your current portfolio. My goal is to bring light to strategies that can be helpful to you that certain managers might not cover.

Good luck to all 🙂

~George


Happy New Year!

Happy New Year to all and what a year of celebration for the bulls in 2016. The major averages last year notched very impressive gains. The Dow Jones Industrial Average (see chart below) finished the year up 2,337 points or 13.42%, the tech focused Nasdaq (click here for chart) closed up on the year 376 points or 7.5%, the S&P 500 (click here for chart) closed up 194 points or 9.54% and the small-cap Russell 2000 (see chart below) finished out 2016 up a whopping 221 points or almost a 20% gain outperforming most benchmarks. This eye-popping rally really kicked into high gear after the stunning upset victory Donald Trump pulled off over Hillary Clinton in the presidential election. So that was last year, now let’s take a look at 2017 and what lies ahead.

I begin with the obvious. Markets are certainly overbought and have been since the November 8th election results. Then in December, the Federal Reserve raised interest rates for the first time in a year and then added language for an additional rate hike in 2017 to bring the total projected rate hikes this year to at least three. Historically a rising interest rate environment puts pressure on equities and in particular the high beta names. Consensus has it that the Fed will move slowly to avoid any shocks to the economy or the markets. However, with Donald Trump’s proposed economic pro-growth policies, debt and inflation should rise. So I am sure the Federal Reserve will be keeping a close eye on how inflation ticks up as 2017 unfolds. Should inflation rise faster than anticipated this too could be a challenge for the Fed and our stock market.

So based on our current market environment it is my view that volatility will not only pick up in January but the recipe described above signals potential elevated volatility throughout the year. We also will begin to hear from corporate America this month as we head into earnings reporting season. I would expect earnings from multi-national companies to be a bit challenged due to the continuing and significant strength that the U.S. dollar has been exhibiting. That said, there will be opportunities abound in this new year but I am preparing to embrace volatility and hedge my positions going forward. In my next blog I will talk about hedging strategies in order to offset the impact of potential increased vol. Until then, both Paula and I wish everyone the happiest and healthiest new year to all. 🙂

~George

Dow Jones chart Paula MahfouzRussell 2000 post george mahfouz jr


As Expected, The Fed Raises Rates…

To no surprise, the Federal Reserve raised interest rates 1/4 point today citing stronger economic growth and a pick-up in inflation. A stronger job market also played a role in the decision of the Fed. What wasn’t quite expected was the language of an additional anticipated rate hike from the projected two hikes in 2017 to now three. This might of caused the slight sell-off yesterday in the markets with the Dow Jones Industrial Average (chart) falling 118.68 points, the S&P 500 (chart) was lower 18.44 points, the Nasdaq (chart) fell 27.15 points and the small-cap Russell 2000 (chart) retraced by 17.51 points.

With all things considered, this pullback was long overdue. In fact, I am surprised that the markets held up like they did yesterday. Especially considering the rip roaring rally most equities have enjoyed since the presidential election. Markets have been on fire with the Dow Jones Industrials (chart) gaining almost 1,600 points, the S&P 500 (chart) ripping 125 points, the Nasdaq (chart) catapulting about 300 points and the small-cap Russell 2000 (chart) up a staggering 170 points. What a breathtaking rally in such a short period of time.

So what can we expect between now and year end? Let’s think about this for a minute. If you are an institutional investor, fund manager, hedge fund or the like would you be taking profits into year end? Or would you wait until we get into the new year knowing that capital gains taxes and corporate taxes are coming down? I think it is fair to say the latter would make the most sense. Add into the mix the rotation that continues out of the bond market and into equities in which certain pundits believe we are in the fourth or fifth inning of that rotation, one has to ascertain that this bull market has more room to run.

Whatever the case I think pullbacks will be bought as momentum continues into year-end. Paula and I wish everyone the happiest and healthiest holiday season 🙂

~George