The 200-Day Breached…

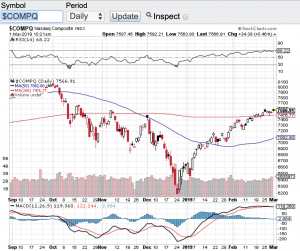
In my March blog I highlighted the 200-day moving average and questioned whether or not this key support zone would hold on the major averages. Low and behold the 200-day moving averages were breached for the better part of the month only to come roaring last week. The Dow Jones Industrial Average (see chart here) closed the month up slightly at 33274, the S&P 500 (see chart here) also closed in the green at 4109, the Nasdaq Composite (see chart here) closed the month up at 12221 points, however the small-cap Russell 2000 (see chart here) did not recapture its 200-day and closed the month of March lower at 1802.

As mentioned above, although the markets experienced heavy selling pressure last month which was fueled by the collapse of Silicon Valley Bank, in the final the week of March the markets experienced a meaningful rally which propelled most of the major averages right back through their respective 200-day. The response to this 200-day breach and how the major averages blew right past this technical line is seemingly bullish.

With the first quarter in the books market participants will now begin to focus on Q1 earnings reporting season to see how well corporate America is doing. Last month there was the shock of Silicon Valley Bank failing and that certainly drew the attention of the Federal Reserve. This event may guide the Fed going forward to change their current interest hike program. If the Fed starts easing interest rate hikes this could help the overall selling pressure that the markets have experienced so far this year. Furthermore, if Q1’s earning reporting season goes better than expected or at least if companies guide up a bit, this may be enough to quell the selling.

Let’s see what is in store for April and hopefully we continue to see the selling pressure ease up. Good luck to all 🙂

~George

Best Start Of The Year In Decades!

Stocks have opened the month of March rip roaring again adding to the best start of the year for the averages in decades. The Dow Jones Industrial Average (see chart here) opened the trading day up over 200 points, the S&P 500 (see chart here) opened up over 20 points, the Nasdaq Composite (see chart below) opened up over 55 points and the small-cap Russell 2000 (see chart here) opened up over 11 points. These gains are adding to the double digits percentage gains the markets have already realized in 2019.

So why such a strong start to the year? I am not trying to sound like a broken record but this 10 year long bull market is a head scratcher.  No matter what has been thrown at one of the longest bull markets in history, nothing seems have an adverse affect. You name the crises and stocks shrug it off. Whether it is a geopolitical event, the Federal Reserve raising rates or the daily chaos that comes out of Washington, nothing has disrupted this incessant rise in stocks. We did get a definitive correction late last year in where the bears came out of hibernation and predicted the end of the bull market and that a 40% correction is now imminent. Well don’t look now but we are not too far off from setting new all time highs in the aforementioned indexes.

Technically speaking it appears that the coast is clear for now as well. All of the major averages are now trading above their respective 20-day, 50-day and 200 day moving averages which is a very bullish sign. The one caveat to the technical shape of the market is that stocks are a bit overextended. Overbought conditions do exist technically and according to the relative strength index also known as the RSI. That said, the pullbacks that do occur continue to be met with support with buyers stepping in willing to add to their existing positions or open up new positions. The trend remains your friend in our current environment. Good luck to all 🙂

~George

Nasdaq Composite - Paula Mahfouz