Finally A Tradable Market!

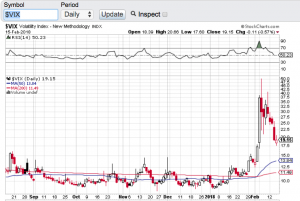
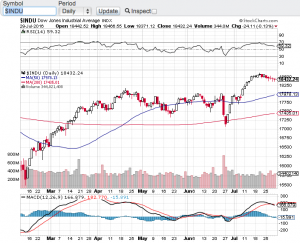
After years of essentially low to no volatility, traders finally get what they have been wishing for and that is a tradable market! In 2017 the markets witnessed the longest stretch of low vol in recent memory. In fact the VIX (see chart below) which is the ticker symbol for the Chicago Board Options Exchange volatility index traded in the 10 zone for most of 2017. The 10 level on the VIX (chart) is beyond abnormally low especially lasting for the better part of a year. Fast forward to today and the VIX is hovering around 20 after spiking to over 50 over the past two weeks. We haven’t seen the VIX (chart) at the 50 level in years. Call it long overdue, call it the market needed to correct, call it higher interest rates, call it what you want but finally we seemingly have more of a normal market environment. Not to say it wasn’t gut wrenching watching 1000 point Dow Jones Industrial Average (chart) intra-day swings over the past couple of weeks compared to the slow melt-up investors have enjoyed for years. Traders on the other hand have underperformed the markets during the melt-up because there simply was not enough or no volatility to be able to trade.

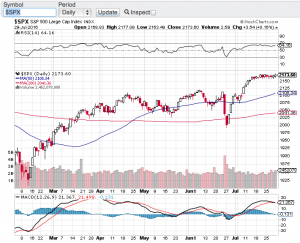
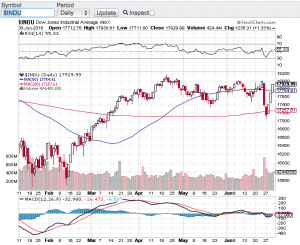
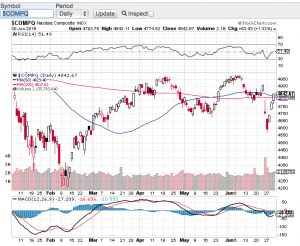
Stocks have indeed bounced sharply from the early February market correction. The Dow Jones Industrial Average (chart) closed the day up 307 points, the tech focused Nasdaq Composite (chart) closed up on the day 113 points, the S&P 500 (chart) closed up 32.5 points and the small-cap Russell 2000 (chart) finished the trading session up 15 points. Going forward I am certainly going to respect the technical make up of the aforementioned indexes and select stocks. Moving averages such as the 20-day, 50-day and 200-day tend to provide reliable support and resistance marks and now that we are out of the no vol environment, these moving averages tend to be more accurate and can be used to determined entries and exits in positions you hold and or trade. As I write this blog the key indexes have now rebounded to their 50-day moving averages so we will see if this technical indicator will act as resistance or if the markets can hold, breakthrough and proceed higher. Of course there is much more to consider when entering or exiting any position or strategy but when volatility comes back into the markets, most professional traders key in on the moving averages. Good luck to all 🙂

~George

VIX - Paula Mahfouz

New Year, New Records?

Happy New Year! Will 2018 be a new year of new records? Nothing would surprise me. Especially as the Dow Jones Industrial Average (chart), the S&P 500 (chart), the Nasdaq (chart) and the small-cap Russell 2000 (chart) shattered record after record after record in 2017. In fact the Dow Jones Industrial Average set 70 record closing highs in 2017. That’s not a typo folks, 70 record closing highs. The other aforementioned key indices also set multiple record highs throughout last year. So could we see a repeat performance in 2018? I don’t know about another 70 record highs this year but I would not be surprised to see continuing strength in the markets in 2018. Yes the Federal Reserve is now in a rate hike mode which typically does not bode well for stocks, but this Fed and central banks from around the world understand the need to go about their new rate hike policies in a gradual manner. Raising rates too aggressively could be the exact catalyst to put the brakes on this almost decade long bull market. I don’t think this will be the case at least with our own Federal Reserve. Jerome Powell will be replacing Janet Yellen in early February as our new Federal Reserve Chairman. Mr. Powell who has been a member of the Federal Reserve’s board of governors since 2012 has voted for keeping interest rates at bay while the economy continues to recover.

Speaking of the economy, expansion continues to occur and we will soon find out how our economy is  trickling down into corporate America. Fourth quarter earnings reporting season will begin here in January and this could very well serve as a key catalyst for the continuation of the bull market. That said, I think most investors and traders are looking for the markets to pause and pullback from this historic run we continue to be on. It is truly breathtaking to witness the record pace that stocks have enjoyed for years now. Personally, I hope and some point in time we do get a meaningful pullback so we can have the opportunity to step in at lower prices. Good luck to all and Paula and I wish everyone the healthiest and happiest new year! 🙂

~George

Russell 2000 – All Time High!

So now the small-caps join in! The Russell 2000 (chart) closed the week at an all time record high of 1490. For most of the year the widely followed small-cap Russell 2000 has lagged the other major averages. Now it has broken out, see (chart). In fact, when you look at the chart of the Russell, one can say this index has gone parabolic. The Nasdaq (chart) and the S&P 500 (chart) also closed at their all time highs on Friday, while the Dow Jones Industrial Average (chart) posted yet another positive week. What’s more is the month of September is typically one of the weakest months of the year for equities losing on average of 1.5% happening 70% of the time since the 1970’s. Not this year, in fact there have been so many record-breaking closes on all of the aforementioned indices it’s hard to keep track.

Question is, now what? With the third quarter of the year now in the books, Q3 earnings reporting season is right around the corner. I have got to believe with the Federal Reserve closing the chapter on their quantitative easing policy and now taking those assets off of their books, plus interest rates scheduled to rise, investors should pay closer attention to the health and growth of corporate earnings. Do you remember the days when earnings and earnings growth actually mattered? Well those days may be back upon us. Hence, the report cards that come in from corporate America may actually move the markets in a fundamental way. This we have not seen in almost a decade. However, if the market momentum that we have experienced since the election continues, and investors ignore the fundamentals, then why couldn’t we end the year at even higher highs?

One thing for sure is October will be filled with many catalysts that should bring in some volatility and a lot of opportunity.  Between now and year end may be the time to implement a hedged strategy where one can potentially profit regardless of how the indexes or individual stocks react to what’s ahead. I’ll cover this in my next blog. Good luck to all. 🙂

~George

Are Energy Stocks And Banks Cracking?

As technology stocks continue to tick up to new record highs, banks and even more so energy stocks are showing signs of weakness. Yesterday, the Nasdaq (chart) hit an all time high of 6221.99 and the S&P 500 (chart) also notched a record recently at 2418.71. That said, the energy sector has lost almost 10 percent in the last month or so and the banking sector is beginning to technically breakdown. A very noticeable divergence is happening here and I think it is time to pay attention to this recent dynamic. The Dow Jones Industrial Average (chart) remains above 21000 and the small-cap Russell 2000 (chart) is seeking direction.

I am not surprised that certain sectors of the market are showing weakness which is only normal with the tremendous run the markets have had since the election, however, it is the sectors that are breaking down that is a bit alarming to me. One has to ask is the price action in oil and energy stocks indicative of weakening demand hence a weakening economy? Or is this just a matter of too much supply in oil regardless of the O.P.E.C. commitment to its production cuts. As far as the banks are concerned, one would also think with the Federal Reserve raising interest rates at their upcoming meeting in June and committing to additional rate hikes this year. that this would be bullish for bank stocks. Not the case recently. I am a little perplexed to the way the tape has been acting as of late especially pertaining to the aforementioned sectors.

The technical shape of the key indices appear to be intact with the exception of the small-cap Russell 2000. The Dow Jones Industrial Average (chart) is trading well above its 50-day moving average, along with the S&P 500 (chart)  trading near all-time highs and the Nasdaq (chart) as mentioned above hit an all-time high yesterday. However, the small-cap Russell 2000 (chart) is trading below its 50-day moving average and has been challenging certain support zones lately. This is yet another potential alarm along with the energy and banking sector weakness lately. So I would not be surprised to see the selling pressure in these particular sectors continue in the month of June which is historically one of the weakest month of the year for stocks. Good luck to all 🙂

~George

Solid Gains In Q1!

The major averages closed out the first quarter of the year posting solid results. The Dow Jones Industrial Average (chart) closed up 4.6%, the S&P 500 (chart) closed up 5.5%, the small-cap Russell 2000 (chart) gained 2.1% and the technology focused Nasdaq (chart) finished out the first quarter of the year up an eye-popping 10%. It’s no surprise how well tech did in Q1 considering how much this sector sold off after Trump won the election.

Although stocks continue to outperform, there has been some uncertainty coming into backdrop. The GOP’s inability to pass Trumpcare was the first sign of the potential breakdown of the new administration’s policies. Investors are beginning to wonder whether or not there will be more divide amongst republicans and how that could affect the upcoming tax reform bill. If there are any snags there or if that reform does not pass, some market pundits believe a 10-20% correction could occur.

Here are my thoughts about that. I do agree that if the proposed Trump tax reform does not go through, there indeed could be an immediate market reaction to the downside. How much, who knows? The markets are seemingly priced to perfection and then some. So if corporate tax rates are not reduced as Trump and his administration has outlined, why wouldn’t stocks be affected? Of course we will not know until late summer how the administration’s new tax policy will look like in its final state or whether or not it will even pass.

That said, there is plenty of runway between now and then for stocks and this starts with first quarter earnings reporting season. April is the month in which companies begin to report their earnings results to their shareholders. Corporate profits appear to be growing along with the economy. This my friends is where investors should be valuing stocks. So much emphasis has been put on the new administration’s economic and tax reform policies that we need not to forget about what really matters and that is corporate profits. That is not to say that government polices including the Federal Reserve don’t matter, but at the end of the day and when all the votes are in, growth and profits to me is what truly matters when valuing and investing in stocks.

Good luck to all 🙂

~George


Markets Cheer Fed Rate Hike!

As expected, the Federal Reserve raised short term interest rates by one quarter point and indicated that they will keep raising rates throughout the year albeit gradually. I do think what helped the markets yesterday was the language of only two more rate hikes this year. The economic data coming out so far is stronger than expected including the February jobs report which confirmed how the job market is continuing to expand and this had some pundits thinking three more rate hikes were in the cards for 2017, not just two. Markets rallied once again on the news and quite frankly the market is seemingly rallying on anything that hits the tape. That said, the Federal Reserve is doing a masterful job with how it is handling the change of guard so to speak from accommodation to raising rates and how they are communicating each message.

So what does this mean to the markets going forward? I gotta tell you as much as I have been expecting volatility to increase, my expectations now are as long as the Fed remains in its current position, volatility may just stay in hibernation until further notice. I have not seen a market to where vol has been and remains this low. As I write this blog the CBOE Market Volatility Index also know as the VIX remains historically low and even when there is pressure on stocks, the VIX does not move very much, just look at the chart below.

Taking a look at the four major indices, The Dow Jones Industrial Average (chart), the S&P 500 (chart), the Nasdaq (chart) and the small-cap Russell 2000 (chart) all are within striking distance of their record highs. The question now becomes will valuations be able to support the continuation of this bull market or will this be the catalyst to bring pause into this historic bull run. We won’t have to wait too much longer as the first quarter of 2017 winds down and companies prepare to report their earnings results beginning in April. Paula and I wish everyone a very safe and Happy St. Patrick’s Day 🙂

~George

VIX chart - Paula Mahfouz


Simply On Fire!

Stocks continue to set records and now on a daily basis! As I am writing this blog the Dow Jones Industrial Average (chart) is now trading north of 20440, the S&P 500 (chart) is trading well above 2300, the Nasdaq (chart) is trading above 5750 and the small-cap Russell 2000 (chart) set an all time high yesterday at 1398! I continue to be amazed on how resilient the markets have been and continue to be. Earlier this month it appeared that the Trump rally stalled out and it was becoming a wait and see environment. Well now the Trump rally has seemingly reignited. Trump last week announced he has major news forthcoming on his tax plan and that was apparently the cue for the markets to rally yet again. However, one has to ask how many more tweets, news conferences or headlines can take the markets higher? Without question the above key indices are becoming overbought and especially pertaining to the relative strength index also know as the RSI. Let’s take a look.

Currently the Dow Jones Industrial Average’s RSI (chart) is trading at a 73, the S&P 500 (chart) RSI is also currently at 73, the Nasdaq (chart) is even higher at 77. The only laggard pertaining to the relative strength index and being in an “overbought” condition is small-cap Russell 2000 (chart) in which its RSI is currently at the 60 value level. Remember the relative strength index is a widely utilized technical indicator that certain institutional traders include in their models along with a variety of algorithm trading platforms. The RSI is a momentum indicator that tracks the size of gains and losses over a given period of time with the 70 value level and above as overbought and the 30 value level and below as oversold. One of the concerns certain market technicians have is that these all time highs and overbought conditions have been occurring on relatively light volume. Without trying to call a top here, I suspect that the aforementioned indices and some of the overbought stocks within these indexes are due for a pullback.

Good luck to all and Paula and I wish everyone a Happy Valentine’s Day 🙂

~George


Quietly The VIX Elevates…

Over the past week the CBOE Market Volatility Index aka the VIX (see chart below) has risen over 35%. Not too surprising considering the upcoming elections and the daily rhetoric that has been hitting the wires. What is surprising to me is that even though volatility has spiked recently, the markets have not really dropped. Isn’t how this is supposed to work? Increase in vol equals lower stock prices? The Dow Jones Industrial Average (chart), the S&P 500 (chart) and the Nasdaq (chart) all remain within striking distance of all-time highs and so far these key indices do not seem to be too bothered by the daily political headlines. Even Friday’s surprising if not shocking news that F.B.I. director James Comey has re-opened the Hillary Clinton email case could not rattle the markets. Although this particular headline did send stocks sharply lower in the late afternoon trading on Friday only to find support and close off of the lows.

I will say this; I am even more surprised that yesterday we did not see a sell-off in stocks after everyone had time to digest the news over the weekend. Stock market pundits continue to claim that the markets have priced in a Clinton victory and that her taking the White House in general will be bullish for stocks. I tend to agree with this however; my concern is will this be a “sell the news” event? I will also be paying closer attention to the polls this week to see if the Trump campaign closes in on the Clinton lead. This too can be a market moving dynamic. So as the VIX continues to lift and as we get closer to November 8th, I will error on the side of caution and lighten up any long positions and wait to see how this election plays out. Let’s also see how the markets react and respond to the election results and then come up with a game plan into year-end. Good luck to all 🙂

~George

VIX chart George Mahfouz Jr

Is It Time For A Breather?

Stocks have been on a tear since the end of June with the key averages gaining close to 10% or more since coming off of their late June lows. That’s right double digit gains in a little over a month lead by the Nasdaq (chart) which is almost up 13%, followed by the small-cap Russell 2000 (chart) up 12.35% and both the S&P 500 (see chart below) and the Dow Jones Industrial Average (see chart below) closing up nearly 10% in that same time period. Part of the reason why the tech focused Nasdaq has led the charge is the stronger than expected and recently announced quarterly earnings results out of Amazon (NasdaqGS: AMZN) Apple (NasdaqGS: AAPL), Facebook (NasdaqGS: FB) and Google aka Alphabet (NasdaqGS: GOOGL).

So the question now is after such dramatic double digit gains in the aforementioned indices and in such a short period of time, is it time for a pause and/or a retracement? As you all know by now, the first thing that I look at when it comes to accelerated gains in any stock or index is the relative strength index also known as the RSI. The relative strength index is a technical indicator to determine overbought or oversold conditions, click here  for the complete definition. The RSI is also one of the favorite technical indicators used by market technicians, certain money managers and even select algorithms have the RSI programmed into their model. That said, the Nasdaq has now hit the 70 value level of the RSI which is an overbought level according to the RSI while the other key indices are not too far behind. Please note that indexes and stocks can remain overbought for extended periods of time.

So what does all of this mean? Well I think the set-up now is a little spooky. Not only are we at or approaching overbought conditions according to the relative strength index, but we now find ourselves in the month of August. August historically tends to be one of weakest month of the year for equities. In fact, over the past seven years the key indexes have fallen each year during this time period. History doesn’t always have to repeat itself, but the current set-up bodes well for a softer month ahead. We will see. Good luck to all 🙂

~George

S&P 500 George Mahfouz Jr

Dow Jones Chart George Mahfouz Jr

What A Rollercoaster Ride!

This week started off with the vote no one expected. Global markets were shocked with the outcome of the United Kingdom’s vote to the leave the European Union. Here at home, the Dow Jones Industrial Average (see chart below) lost close to 1,000 points between Monday and Tuesday, the Nasdaq (see chart below) over that same two-day period lost close to seven percent as did the S&P 500 (chart) and the small-cap Russell 2000 (chart). A breathtaking 2-day drop which was so swift and profound that it violated the 200-day moving averages of all of the aforementioned indexes. Fast forward to today and what seemingly was the start of an angry correction, has turned into yet another “buy the dip” opportunity. No matter what the challenges are or have been on the macro-economic or political front, markets over the past several years have shrugged them off. I honestly did not think stocks would snap back this time as quickly and as powerfully as they have.

Yet again, oversold conditions created a trader’s dream with this snap-back rally. Ever since this bull market began, every shocking or unexpected headline which have rattled the markets have always been met with strong support that then turns into the resumption of this protracted bull market. However, it is also very clear that we have been trading in a range for quite some time now and every time we have tried to breakout of this trading range, resistance is met and we retrace back to a variety of moving averages.

So you may be asking how do we break out of this S&P 500 (chart) 2000 to 2120 trading range? One catalyst that can do this is the upcoming second quarter earnings reporting season which kicks off here in July. I do not think that the economy is such that record earnings results will come forward. In fact, companies may take it upon themselves to use the Brexit circumstance to soften their future guidance? We will see. In my humble opinion I think the possibility of a downward break is more probable in the near term than stocks breaking out to all-time highs, especially after this snap back rally. Good luck to all!

Paula and I wish everyone a safe and Happy 4th of July holiday 🙂

~George Mahfouz, Jr.
Dow Jones George Mahfouz JrNasdaq George Mahfouz Jr.