The New Norm…

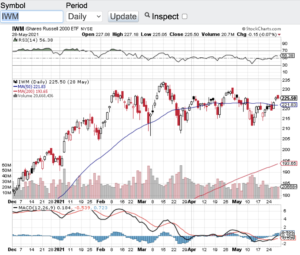
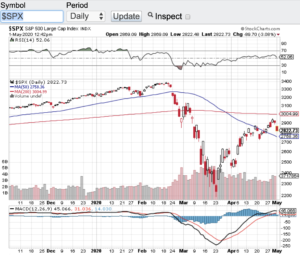
I think it is becoming safe to say that we are now in the new norm! The stock market for over a decade has feasted on the Federal Reserve’s accommodative policies and most recently the stimulus provided by governments from around the world during the pandemic. Under normal market conditions, stocks trade on their own merits and prospects. This has simply not been the case in years. Fast forward to today and we now have a Federal Reserve raising interest rates, reducing their own stimulus programs to stave off inflation and get back to more normalized Fed policies and procedures. Now the markets are taking notice. Volatility in the markets continue as has been the case for months now. Year to date, the Dow Jones Industrial Average (see chart here) is down 10 percent, the S&P 500 (see chart here) is lower by 15%, the Nasdaq Composite (see chart here) on the year is down almost 25% and the small-cap Russell 2000 (see chart here) is down about 18%.

Yes, I believe we have entered a new norm. Which isn’t necessarily a bad thing from the standpoint of properly evaluating companies. What’s been very difficult during the past decade or so is how to evaluate public companies. The Federal Reserve and its unprecedented accommodative monetary policies was a huge driver of how companies were valued. Meaning this, when there are hardly any choices of attaining yield whether it is from stocks or bonds, this forces capital into the stock market or other higher risk assets. This has been one of the primary drivers of the incessant bull market investors have enjoyed over the years. Now, companies are going to have to perform to maintain their position in the marketplace. The ones that do, will be rewarded, the ones that don’t will experience adjustments in their valuations.

With all the above being said, I am confident that once the stock market bottoms out, there will be great opportunities to consider and act on. Good luck to all 🙂

~George
A Tough Quarter For Stocks…

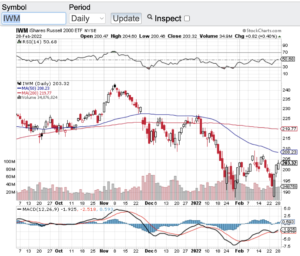
It was a tough quarter for stocks as the markets dealt with and continues to deal with the war in Ukraine, runaway inflation, rising interest rates and the seemingly never ending Covid dynamic. For Q1, both the Dow Jones Industrial Average (see chart here) and the S&P 500 (see chart here) lost nearly 5%. The Nasdaq Composite (see chart here) lost more ground closing out the quarter down 9%. Last but not least, the small-cap Russell 2000 (see chart here )  also closed Q1 down 9 %.

As mentioned above, it was a tough quarter for stocks and indexes but with the current state of global backdrop my feelings are we are quite lucky to not of experienced more of a drawdown. In fact, I am very surprised if not shocked that we did not see a 20 percent sell-off or more due to these major headwinds. So, this begs the question as to why there was not more of a correction? Could it be corporate earnings will surprise the street once Q1 earnings reporting season kicks off here in April? Or could it be that while interest rates are going up and will continue to do so, that rates are still relatively low, and money continues to get put to work in the overall markets? I do think that this upcoming earnings reporting season will be one of the most important metrics in years pertaining to whether stocks find their footing or continue to be under pressure. The one other metric I will be paying close attention to is yield curve inversion. For the first time in years the 2-year Treasury yield surpassed the 10-year and historically when that happens the chances for a recession increase. So, as you see there is much to learn over the coming weeks and throughout the summer.

Last but not least, when I look at the current technical shape of the aforementioned key indexes, all of them are trading right around their respective 20-day, 100-day and 200-day moving averages. Based on this action it is possible that we see a breakout above and/or a breakdown below these historic support and resistance lines.

Good luck to all 🙂

~George


Volatility Hits The Markets…

Volatility has hit the markets to the point that the VIX (see chart here) aka the fear gage has broken out. Stocks have been on a tear as of late but unfortunately to the downside. No one is surprised that the markets have become extremely volatile due to the Russian invasion of Ukraine. The Dow Jones Industrial Average (see chart here) fell over 10% since the crisis began as has the S&P 500 (see chart here). Both the Nasdaq Composite (see chart here) and the small-cap Russell 2000 (see chart here and below) have sold off closer to 15% before bouncing off of their sell-off lows. Again, no surprise that vol has spiked to almost a double over the past few weeks as tensions increased.

Before we get into the technical shape of the markets it’s hard for me to even talk stocks and indexes due to the atrocities happening abroad. Our prayers go out to everyone in the Ukraine that is being affected by this invasion and for the people of Russia who wants no part of this. Hopefully very soon a cease fire will happen and happen for good!

Now let’s look at the technical set-up that has occurred since the buildup and invasion with the aforementioned key indexes. Starting with the Dow Jones Industrial Average (see chart here). The Dow a few days ago hit a low of 32272 and has bounced to the 34,000 zone. There is much more work here to be done before the Dow can recapture its 100 and 200-day moving averages. The same can be said for the S&P 500 (see chart here) although with the S&P, it is closer to its 20-day M/A than the Dow Jones Industrials Average. Interestingly both the Nasdaq Composite (see chart here) and the small-cap Russell 2000 (see chart here) have bounced off of their recent lows stronger with the Russell 2000 recapturing its 20-day M/A. Despite the recent bounces off of their sell-off lows I think it is fair to say that we are not out of the woods yet in the volatility we have seen as of late. If you are a long-term investor, this will pass at some point in time. For experienced traders this is an environment where money can be made both on the long and short side of the markets. That said, I always recommend consulting your certified professional financial advisor(s) before making any moves in the backdrop we currently find ourselves.

Good luck to all 🙂

~George

Volatility Hits The Markets - Paula Mahfouz

Risk On Remains On!

Risk on in the markets remains on as we approach the second half of the year! It’s truly remarkable to me how stocks, crypto, real estate and other asset classes are still trading at or near all time highs. I do get that the ongoing accommodative policies provided by our Federal Reserve and from central banks across the globe is the main reason why asset prices continue their bullish ways.

That said, I do think it is time to start considering how things could look once the Federal Reserve in our country starts backing away from its accommodative monetary policies and as interest rates begin to normalize. This is not a question of if, it’s a question of when. Tell tale signs of inflation are now seemingly everywhere which is what the Federal Reserve is paying close attention to and could be the catalyst for the Fed to act. It is at this point our markets could be adjusting to align with real interest rates and normalized price to earning multiples. To that end, we have and continue to witness the most unique market conditions ever seen. So I am not calling a top here and I do respect the power of the Federal Reserve, however, I am just suggesting that we may see a healthy and overdue adjustment in asset prices which may not be such a bad thing. There are many investors that are on the sidelines and would be more than happy to step in should we see asset prices adjust to a lower entry point.

Let’s take a quick look at the technical shape of the major averages. The Dow Jones Industrial Average (see chart here), the S&P 500 (see chart here), the Nasdaq Composite (see chart here) and the Small Cap Russell 2000 (see chart below) all are trading above their 20, 100 and 200 day moving averages. This alone is a strong technical backdrop and what’s more is none of the aforementioned indexes are currently overbought according to the relative strength index aka the RSI. So technically speaking things look pretty good right now.

Good luck to all 🙂

~George

Risk On Remains On - Paula Mahfouz


The Best Quarter For The Major Averages In Decades!

We just witnessed the best quarter in the major averages in decades. Yes folks it is hard to believe that stocks are performing the in way that they are with all things considered. The Dow Jones Industrial Average (see chart here) is trading near the 26,000 level, the S&P 500 (see chart here) is trading this morning at the 3,120 level, the Nasdaq Composite (see chart here) is back over the 10,000 mark and the small-cap Russell 2000 (see chart here) is trading in the 1,450 zone.

The strength of stocks in general is one for the ages. I don’t think anyone would of thought that the markets would continue to show this type of resilience especially with the backdrop of our current unemployment picture and with Covid continuing to run rampant. The only logical reason as to why the Dow Jones Industrial average is not sub 20,000, has to be the continuing liquidity that is coming into the markets provided by Federal Reserve and the government stimulus packages that have launched since the crisis began. Of course there are select tech and pharmaceutical companies that are directly benefiting from the new world we find ourselves but I didn’t expect to see such a wide swath of stocks doing well in this current environment.

Now that the 3rd quarter of the year has begun I think all eyes will begin to focus on second quarter earnings results which kicks off next week. What’s even more important in my eyes is the energy, spirit and guidance that comes out of companies during their earnings conference calls. I am expecting companies to either pull their future guidance or lower earnings expectations, we shall see. Another catalyst that I expect to play a role in how the markets will fare here in Q3 is how the Presidential polls continue to unfold. Currently Joe Biden has a double digit lead over Donald Trump. Some pundits are saying that the markets are beginning to price in a Biden win. Candidate Biden has already stated that he will raise the capital gains and corporate taxes should he become President. If this is the case, higher taxes would negatively affect net earnings but this scenario could be offset by other positive geo-political factors should Biden win.

Good luck to all 🙂

~George

A Stunning Comeback!

Stocks pulled off one of the most stunning comebacks in recent memory. Despite Covid-19’s rapid acceleration which is afflicting millions, the stock market made one of the sharpest and quickest recoveries off of the bottom we hit in late March. The Dow Jones Industrial Average (see chart here) gained over 11% in April, the S&P 500 (see chart below) posted a 12.7% gain, the Nasdaq Composite (see chart here) closed up over 15% and the small-cap Russell 2000 (see chart here) posted a whopping 22% gain in the month of April. Let’s not forget we are still off of the all time highs set earlier in the year but I don’t think anyone expected the magnitude of the rally that we just witnessed. There is no question that hopes of re-opening the economy and the latest advancements on therapeutic treatments and vaccines also played a role in the April rally.

Let’s look at it deeper than the just scientific advancements. The Federal Reserve actions and the recent stimulus packages issued by our government has also played a significant role in the eye-popping rally. With all of constant news flow and developments that comes out on Covid, I do think it is hard to realize how impactful the government stimulus packages and the new Federal Reserve stance is and what it does mean to the economy and markets now and going forward. I think it is fair to assume that once there is a definitive and stabilizing solution for the Covid crisis, that our economy and markets should have no problem taking off again. Until then, let’s all pray for a rapid solution to this ugly virus that has wreaked havoc on society. I do believe and have always believed in humanity and for science to lead the way.

Let’s take a quick look at the current technical shape of the the key indexes. We can all expect the markets to pull back after such a sharp bounce back rally. This is the case as I write my blog today. The markets are pulling back to their 20-day moving averages. Typically the 20-day, 50-day and especially the 200-day moving average acts as near term support levels. Let’s see if the current 20-day moving average holds as a near term support level as we head into the weekend.

Good luck to all 🙂

~George

A Stunning Comeback - Paula Mahfouz


A Week To Forget…

Certainly, a week to forget! Not since the depths of the 2008 financial crisis have we seen volatility so high (see chart here) as stocks and indexes react to the spread of the coronavirus. Last week, the Dow Jones Industrial Average (see chart here) saw multi-thousand point swings. The S&P 500 (see chart here) was not spared from the highest volatility in a decade. The Nasdaq Composite (see chart here) and the small-cap Russell 2000 (see chart here) both experienced eye-popping swings as well. However, on Friday the President declared a national emergency and he announced a $50B relief package to combat the coronavirus. Stocks took that cue and had one of their best day’s ever with the Dow Jones Industrial Average (chart) soaring almost 2000 points, the S&P 500 (chart), the Nasdaq Composite (chart) and the Russell 2000 (chart) all gaining almost 10% on the day.

Now we find ourselves in a highly volatile environment that in my opinion won’t abate until more metrics come forward pertaining to the spread here in the U.S. and the plans to contain it. The administration took a huge step yesterday by declaring a national emergency and to promise the full resources of the government to combat and control this virus. Furthermore, the government is waiving interest rates on student loans and committed to buying oil from U.S. companies to “fill up our strategic reserves”. It’s no wonder stocks had one of their best days in history.

I always like to conclude my blogs with a take on the technical shape of the key indexes. Needless to say there was a lot of technical damage done last week pertaining to technical makeup over the markets and in particular the moving averages. All of the major indices broke their respective 20-day, 100 and 200-day moving averages. These are all significant support zones that have been broken through. The one bright spot in this dynamic is the selling was so severe that after the dust settles strong rallies can and do typically occur as we witnessed on Friday. We are also now way below the key moving averages that often times the markets go back to retest those averages. If this does occur the set-up is very promising for bargain hunters. That said, I am not suggesting that the markets will rip roar back anytime soon, but historically strong rallies do occur after panic selloffs.

Good luck to all 🙂

~George

Fear Of A Global Pandemic Grips Markets!

Stocks went into a tailspin as fear of a global pandemic grips the markets! New outbreak clusters of the highly contagious coronavirus are beginning to surface which is pressuring leaders from around the world to act and act more aggressively. Stocks have also entered correction territory as companies and analysts begin to ratchet down their revenue and earning forecasts. Over the past week or so the Dow Jones Industrial Average (see chart here) has lost over 10% in the past week alone, the S&P 500 (see chart here) has also entered into correction mode, the Nasdaq Composite (see chart here) has been hit hard and the small-cap Russell 2000 (see chart here) is also witnessing a sharp sell-off.

Personally I believe a correction was needed because of how robotic the markets have acted. Stocks no matter what risks were out there behaved in a way never before seen. We have been in the strongest bull market ever and nothing over the past 12 years could slow this bull market down. Now I am not happy that it is a global health risk that’s the catalyst to put stocks in correction mode, but nonetheless this is where we find ourselves. Of course when fear is rampant in any market this is where opportunity can be found. I am not suggesting to jump in here because as we all know fear and/or greed can be excessive and markets tend to over do it when emotions take the lead over rational thinking. So when we get overextended to the upside or downside the first thing I look at is how the technicals look during extreme market moves.

When I now look at the technical shape of the markets at least at it pertains to the moving averages things do not look so good. The Dow Jones Industrial Average (see chart here), the S&P 500 (see chart here) and the Russell 2000 (see chart here) have all breached their 20-day, 100-day and 200-day moving averages which are all seen as major support zones especially the 200-day. The Nasdaq Composite (see chart here) is the only major index that has yet to close below its 200-day. That said, all of the aforementioned indexes are oversold according to the relative strength index (RSI) which when we see the 20 value level hit on any stock or index, snap back rallies can and do occur. This type of market is great for traders if you are experienced enough to trade off of technicals, however for investors that have a long term view these type of market environments requires a lot of patience and keeping the emotions at bay. Let’s all hope that the spread of the coronavirus abates and that a vaccine becomes available as quickly as possible.

Good luck to all 🙂

~ George

Coronavirus Hits Stocks!

The coronavirus hit stocks and major indexes this week as fear grips investors. The Dow Jones Industrial Average (see chart here) fell over 600 points yesterday, the S&P 500 (see chart here) closed lower by 58 points, the Nasdaq Composite (see chart here) fell 148 points and the small-cap Russell 2000 (see chart here) closed yesterday down 34 points. Now if you have been following me for a while you know I am a big fan of pullbacks in the market. However, I don’t like seeing the cause of this latest sell-off. I would much rather prefer to see the market retrace in a healthy manner versus a health crisis.

Some of the fear the market is experiencing is warranted. Companies are suspending business to and with China which clearly will have an impact on their businesses.  For example airline stocks have taken it on the chin recently. Most major airlines have suspended service to China and in some instances for months. Entertainment companies such as Disney (DIS:NYSE), Carnival Cruises (CCL:NYSE) and Royal Caribbean (RCL:NYSE) are also feeling the pressure due to closures and suspension of services. These companies and companies alike are doing the responsible thing here until the World Health Organization establishes the proper plan to contain the spread of this fast moving virus.

To that end, yes the coronavirus is a global threat for now. Past viruses such as the coronavirus are serious health risks and this one is no different. However, for market participants past events like this have ended up being opportunities in the marketplace. Of course the highest priority here is to not only stop the spread of the virus, but to find a swift treatment for it. Until then I do expect continuing volatility in the markets.

In the short term my plan is to be patient and not to act in haste. Historically when situations like this occur and then move to a respite, markets begin to settle in. Good luck to all 🙂

~George

Upward Trend Remains Intact!

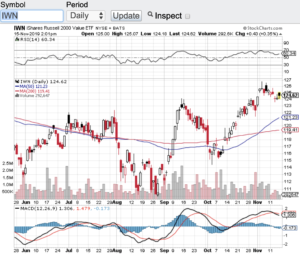
Record highs continue as the upward trend in the stock market remains intact! Despite the impeachment proceedings now going public and despite the China trade deal seemingly pausing we are still setting records. The Dow Jones Industrial Average (see chart here), the S&P 500 (see chart here) and the Nasdaq Composite (see chart here) all hit record highs this week. The small-cap Russell 2000 (see chart below) is holding its own in the overall upward trend, however, this index remains below its all-time high by 150 points or so.

The good news today coming out of the White House is that we are getting closer to a deal with China. This news was enough to send the Dow Jones Industrial Average (chart), the S&P 500 (chart) and the Nasdaq Composite (chart) to all time highs yet again. It is incredible that just a blurb out of the White House regarding a potential deal sends stocks rip roaring ahead. One of the concerns I have about actually seeing a deal get done by year-end is that next week it is possible a tweet from our President may read the exact opposite. If you look back and think about it how many times have we seen a tweet or an announcement that a deal is getting closer only to have the next statement speak to the exact  opposite. Hopefully today’s announcement (click here) sticks and that we actually see a trade deal get done by year-end. No more talk!

If indeed a trade deal gets done there no question this will be good for business here in the U.S. Although it may feel that stocks and the key indexes are overbought, if a deal gets done then it is very possible that we continue to notch records between now and year-end.

Good luck to all 🙂

~George

The Uptrend Remains Intact - George Mahfouz