Happy New Year!

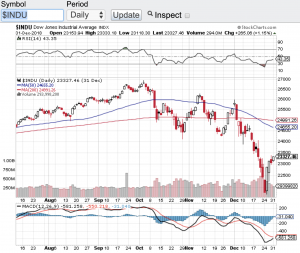
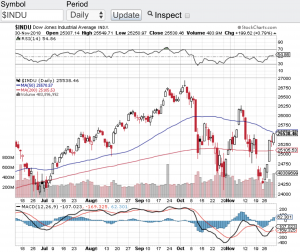
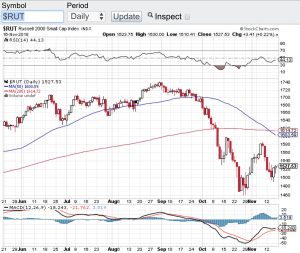
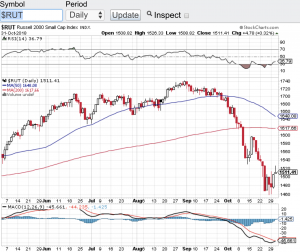
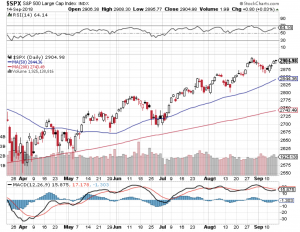
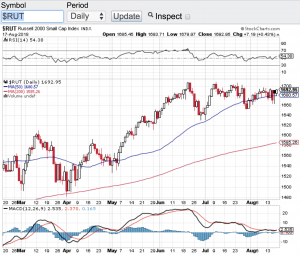
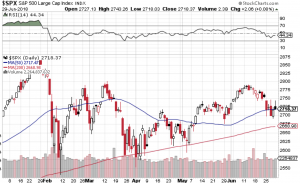
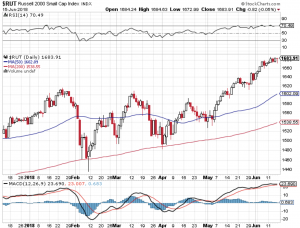
Happy New Year! Well if you have been long the markets and with the way stocks closed out 2018, it wasn’t so happy for the bull camp. However, a new year means new beginnings :-). Let’s do take a gander to see how the major averages fared in 2018. The Dow Jones Industrial Average ( click here or see chart below) finished the year down 5.6%, the S&P 500 (chart) closed the year down 6.2%, the Nasdaq Composite (chart) closed down 4% and the small-cap Russell 2000 (chart) closed 2018 down 12%. This is the worst performing year for stocks in a decade.

So what happened? In my view and simply put how can stocks go up in a straight line for over a decade without a correction? That’s right, stocks essentially have gone up for over 10 years’ without a healthy 20% correction. So when the markets finally had a real correction which is what occurred in the 4th quarter, it felt like the sky was falling. No question the Federal Reserve and rising interest rates have played a role in the market correction, however, let’s keep this in mind a 2-2.5% Fed funds rate is still historically low. What wasn’t normal over the past decade was a 0 percent interest rate policy and no market volatility. Everyone got spoiled with such an accommodative policy and market environment.

Another factor playing into the mix of the Q4 market correction is without question the trade war and tariffs that our President has ignited. This to me is even more of an issue to our economy than rising interest rates lifting to a normalized level. Not only is the trade war and its ramifications playing a role, but the inconsistency and chaos out of Washington are wreaking havoc on the markets.Β  No doubt in my mind that investors and Wall street are falling out of love with how our country is being governed, especially over Twitter. This is all fixable, we will just have to wait and see if the ego’s and the political agendas on both sides of the aisle can get the confidence back in our marketplace. Paula and I wish everyone the happiest and most prosperous 2019.Β  Good luck to all πŸ™‚

~George

Dow Jones Industrial Average - George Mahfouz Jr

Undeniable Market Correction!

Despite this morning’s relief rally, stocks and indexes are either in an undeniable market correction or in an actual bear market. Healthy corrections are 10% or so declines, bear markets are defined by a 20% or more of a decline. This is where the small-cap Russell 2000 (click here for chart) finds itself and that is in a bear market. The Dow Jones Industrial Average (chart) is not quite in bear market mode nor is the Nasdaq Composite (chart) or the S&P 500 (chart). However, these indexes have lost over 6% of their value in December alone. Not since the great depression has the markets been hit this hard in the month of December. Furthermore, market sentiment has not hit this low since the 2008 crisis either.

So what is going on? The default answer to this question is the Federal Reserve and rising interest rates. The Fed actually meets tomorrow to decide on whether or not to raise by a quarter point. I think what’s even more important than whether or not they hike rates, it’s how dovish or hawkish they are in their testimony. I have to believe with how sharp and how fast stocks have corrected they may lean towards the more dovish spirit with a wait and see approach before raising rates again. The other default answer as to why stocks have been beaten down is the confusing messages that constantly flow out of Washington, especially as it pertains to the China trade war. The markets hate to be confused by policy makers especially our President and instead of holding on, clearly investors and traders alike have been dumping stocks for weeks now. If the Fed communicates their intentions clearly and if Washington is capable of doing the same, this could be just a market correction. If not, then I think we could see all of the aforementioned indexes fall into bear market territory. Good luck to all:-)

~George

Historically A Strong Month For Stocks…

December is historically a strong month for the stock market. Many factors play into the last month of the year being a positive one including holiday bonuses, the general overall feeling of optimism and typically lighter volumes due to the holiday season. How we finish out this year will largely hinge on the results of this weekend’s G20 summit. Early indications are that the trade talks and other collaborative measures are going well. As the major averages enter into the last month of the year, The Dow Jones Industrial Average (click here for chart) finds itself at 25,538, the S&P 500 (chart) closed out the month of November at the 2,760 level, the Nasdaq Composite (chart) finished at 7,330 and the small-cap Russell 2000 (chart) finished November at 1,533. On the year, the major averages are barely in the green with the small-cap Russell 2000 actually a tad in the red.

Stocks this past week did get a boost from Federal Reserve Chairman Jerome Powell when Chairman Powell spoke at the Economic Club of New York. Chairman Powell stated that the Fed’s benchmark interest rate was now “just below” the neutral level. This sent the Dow Jones Industrial Average (see chart below) soaring over 600 points on Wednesday. Chairman Powell’s comments are being viewed by the street that the Federal Reserve just might be done raising interest rates for the foreseeable future. Now if we can get some concrete positive news and developments out of the G20 summit which is being held in Buenos Aires, then indeed we could be setting up for a year-end rally.

Let’s take a look at the moving averages technical set-up of the aforementioned key indexes starting with the Dow Jones Industrial Average (chart). At Friday’s close, the Dow is trading above its 200-day moving average by about 400 points while the S&P 500 (chart) closed right at its 200-day. Both the Nasdaq Composite (chart) and the small-cap Russell 2000 (chart) are trading below their respective 200-day moving averages but they have recently cleared and are trading above their 20-day moving averages.Β So technically speaking things do not look too shabby. Let’s see if we can have a rally into year-end.

Good luck to all πŸ™‚

~George

Dow Jones Industrial Average - George Mahfouz Jr

Tariffs and Interest Rates…

Tariffs and interest rates are at front and center. Now that Q3 earnings reporting season is winding down, without question the two remaining catalysts for these markets between now and year-end areΒ  tariffs and interest rates. It’s been a long time since we have seen the swings that are going on right now in the stock market. Investor’s and trader’s alike are attached to every headline or tweet pertaining to the current trade war between China and the U.S. and whether or not the Federal Reserve will take its foot off of the pedal. The growing tensions between China and the U.S. regarding tariffs did abate late Friday when President Trump tweeted that China does want to make a deal. This was enough to rally the markets on Friday afternoon, but not enough to get the the key indexes out of the red on the week. On the week, the Dow Jones Industrial Average (chart) closed at 25,413, the S&P 500 (chart) closed at 2,736, the Nasdaq Composite (chart) closed at 7,248 and the small-cap Russell 2000 (see chart below) finished the week out at 1,527.

With the aforementioned looming catalysts on the horizon the big question is will we get a year end rally? My feelings are we may only need one of these catalysts to come through for a potential year-end rally. If China and the U.S. can agree upon more favorable terms to the imposed existing tariffs and/or actually withdraw some of the existing tariffs, we may have a shot. Not to say interest rates aren’t important, but relatively speaking interest rates still remain historically low. Even if the Federal Reserve raises rates in December, I still think that a China U.S. deal would be enough for a rally as we close out 2018. The G20 summit is just two weeks away and let’s hope some sort of deal can come forward out of the summit. Good luck to all πŸ™‚

~George

Russell 2000 - Paula Mahfouz


A Long Overdue Correction!

It was a spooky time for the equity markets in October as stocks experienced a long overdue correction. You have to go back seven years to have a month that sold off in the way the markets behaved in October. Yes, historically October has been one of the most volatile months of the year. The problem with historical data over the past several years is most of the time history has NOT repeated itself. Stocks have been on a tear for years breaking record after record. In fact not that long ago all of the major indexes had set all time record highs. Fast forward to today and we find the Dow Jones Industrial Average (chart) down almost 7% from its recent all-time high, the S&P 500 (chart) actually fell at one point over 10% from its all-time high finishing the month of October down 8%, the Nasdaq Composite (chart)Β  is down over 10% from its recent all-time high and the small-cap Russell 2000 (see chart below) is off over 13% from its all-time high recorded on August 31st of this year. So I think it is safe to say most of the market is in correction mode.

Next question, is this a healthy correction for the markets and will stocks find their bottom here or could this be the start of our first bear market in a decade? I guess the answer depends upon who you ask. I think it is too early to call out that a bear market is in the making, but one thing is for sure, we have not seen sustained volatility as we have witnessed recently in a very long time. As long as the trade war rhetoric continues to spew out of Washington and as long as the Federal Reserve keeps its foot on the gas pertaining to interest rates, I think the wild swings and volatility will continue. Oh yea, there is also this small event next week called the “mid-term elections” which should also play a key role in continuing vol. Good luck to all πŸ™‚

~George

Russell 2000 - Paula Mahfouz

Traders And Investors Are Awaiting A September Selloff…

Traders and investors are awaiting a September selloff that actually may not come. Stocks continue to demonstrate strength and resiliency despite the political turmoil in Washington DC, rising interest rates and a seasonality headwind that just isn’t happening. August and September are typically weaker months for the stock market, instead the S&P 500 (see chart below), the Nasdaq Composite (chart) and the small-cap Russell 2000 (chart) hit all-time record highs and the end of August and despite a mini pullback shortly thereafter, the markets appear to have stabilized near all time highs. The Dow Jones Industrial Average (chart) did not make an all-time high in August, however, this index remains within striking distance of its all time high. The pundits are speaking to the strength of corporate America where earnings and profits are at their highest levels in decades as to the reason why the markets are not selling off. What is undeniable is that any time stocks have experienced a pull back it has been met with support from institutional investors and retail investors alike.

Speaking of support, let’s take a closer look at the technical shape of the aforementioned key indexes. Let’s start with the S&P 500 (chart). After pulling back to its 20-day moving average the S&P is right back at a breakout point. Next week we should see if the S&P can indeed breakout or fail and head back to its 20-day. The Nasdaq Composite index (chart) has similar chart pattern although it traded a bit below its 20-day support line for a few days before recapturing its 20-day and is now trading above it. A look at the Russell 2000 (chart), it too closed above its 20-day moving average and last but not least the Dow Jones Industrial Average (chart) also closed above its 20-day and this index is also right at a breakout or breakdown point. These bellwether indexes are also not in an extreme overbought condition according to the Relative Strength Index. The RSI tracks overbought or oversold conditions and is a momentum indicator that measures the degree and velocity of recent price changes to determine what is overbought and what may be oversold. We are simply not in any extreme condition according to the RSI principle.

Let’s see how the back half of September plays out and we will revisit the technical set-up of the markets in October. Good luck to all πŸ™‚

~George

S&P 500 - George Mahfouz Jr


Bellwether Indexes Surge To All Time Highs!

Bellwether indexes surge to all time highs as the S&P 500 (chart) closed the month of August at 2901, the Nasdaq Composite (chart) closed at 8109, the small-cap Russell 2000 (chart) closed at 1740 and the Dow Jones Industrial Average (chart) is within striking distance of its all time high. I thought August is supposed to be a tough month for stocks? Not this year! New highs are happening while the political environment in our country is at a seemingly all-time low, the word impeachment surfaces daily now, tariffs are in the headlines daily, interest rates have been on the rise and now it seems that any type of progress made over the summer with North Korea may be in jeopardy. One would think that the aforementioned risks would be enough for an outright 10-20 percent market correction. Add in the seasonality factor and we should indeed be going red, not making all-time highs.

Now I am afraid to even mention that the month of September is historically the weakest month of the year for stocks right alongside with August. Do I dare say that September will be the month that our markets correct in a meaningful way? Do I have the courage to predict that this will be the month where the markets recognize and adjust for all of the risks that are present in our current environment? I don’t know people, I am as baffled as the next guy as to how these markets keep shrugging off real market issues. Oh by the way I forgot to mention we have mid-term elections forthcoming, the markets are not pricing in any risk there either. These markets are priced and acting like there is no absolute risks at all out there. Ok enough banter already!

How to play the markets now? I am a fan of the old adage “the trend is your friend” but folks I just can’t hop on this train at this point in time. I am heading to the sidelines until I see any type of technical breakdown to possibly consider implementing a short thesis or just wait for the inevitable pullback/sell-off to identify any potential long set-ups. Until then, Paula and I wish everyone a very safe and Happy Labor Day weekend πŸ™‚

~George

Trading Between The Lines…

Trading between the lines is how this August is playing out so far. In what is supposed to be a seasonal volatile period, August seemingly has been playing right to the tune of this almost decade long bull market. The Dow Jones Industrial Average (chart), the S&P 500 (chart), the Nasdaq Composite (see chart) and the small-cap Russell 2000 (see chart below) to my surprise have all traded in a tight range this month. Furthermore, the 20-day moving average and even more so the 50-day moving average have played a major role in supporting the indexes whenever any selling does come in. Now we have had a couple days here in August where it looked like these support lines would be breached and in fact in some instances they were. However, whenever these support lines were touched or breached, buying came right in and placed a floor beneath the selling pressure.

I am not sure how the rest of the month will play out but August at least from a seasonality perspective still has the potential to demonstrate volatility and experience meaningful selling pressure. I really do believe that the bear camp expected to see August as their month, but from the looks of things the bears may have to wait until September or beyond. Corporate earnings for the most part have been topping expectations, the economy is seemingly firing on all cylinders and rising interest rates are not that big of a factor yet to be weighing heavily on stocks.

My plan for the rest of the month is simple. Pay attention to the support and resistance zones of the aforementioned indexes and for that matter any stock that I am considering to trade. Secondly, I need to see the trading volume pick up before any definitive trend can be trusted. The market volume just has not been here this month which is also typical of the dog days of summer. Patience is the keyword between now and month end. That said, I expect after the labor day holiday we will be having a much different conversation. Good luck to all πŸ™‚

~George

Russell 2000 - Paula Mahfouz

First Half Of 2018 In The Books…

The first half of 2018 is in the books and where in the world did that go? Year to date the Dow Jones Industrial Average (chart) is off about one percent, the S&P 500 (see chart below)Β is up a couple of percentage points but the Nasdaq Composite (chart) and the small-cap Russell 2000 (chart) are way outperforming the other benchmark indexes closing the first half of the year up almost 10% each.

Let’s take a look how the second half of the year is shaping up. We start off the second half of the year with of course the fourth of July holiday which this year happens to be in the middle of the week. I don’t expect too much market action this upcoming week especially with a shortened trading session on Tuesday followed by the markets closing on Wednesday in recognition of the 4th of July. There could be some positioning going on both Thursday and Friday after the holiday. but all in all I am expecting lighter volume throughout the week with not too much volatility. Now the following week and the second half of the year is a whole different story. Q2 earnings reporting season will begin in earnest the week of July 9th and this my friends will be the true beginning of the second half of the trading year. I expect volatility to kick in once again as corporate America unveils their most recent quarterly results. Furthermore, we will be getting ever closer to the midterm elections that promises to be filled with about as much drama and rhetoric one can imagine. Also, historically stocks have witnessed meaningful corrections at some point during the year leading up to the midterms and I do not expect this year to be any different. I also expect corporate America to report impressive growth to their top and bottom lines; however, these results may already be priced in.

Technically speaking the aforementioned indexes all remain above their respective moving averages with the Dow Jones Industrial Average (chart) hovering right around its 200-day. Paula and I wish everyone a very safe and Happy 4th of July πŸ™‚

~George

S&P 500 - Paula Mahfouz


The Economy Is Booming, But…

There is no question the economy is booming but what does this mean long term for stocks? When the economy is firing on all cylinders like it is now here in the United States one may think the stock market must be ready for its next leg up! Not so fast. Historically when the economy heats up and the unemployment rate becomes so low, that does not typically bode well for stocks. Why you ask? Simply put, the Federal Reserve does not want inflation to rear its head up and their main tool to avert inflationary pressures is to raise interest rates. As counterintuitive as it may seem, a strong economy and low unemployment may be the catalyst to put the brakes on this almost 10 year bull market run. That said, the major averages continue to show extraordinary resilience no matter what comes at it. The Dow Jones Industrial Average (chart) closed the week above 25,000, the S&P 500 (chart) finished the week at 2779, the Nasdaq Composite (chart), finished near its all time high and the small-cap Russell 2000 (see chart below) closed the week out a few points away from it’s all time high as well.

It is quite remarkable how the aforementioned indexes are behaving with all things considered. This past week the Federal Reserve raised interest rates again and signaled two more hikes this year and the trade war chatter and action with China and our own allies for that matter is accelerating. Just these two events alone show be putting selling pressure on stocks not setting new record highs as is the case this past week with the Nasdaq Composite (chart) and the Russell 2000 (chart). These indexes also remain well above key moving averages which at some point in time reversion to the mean should occur. I will be looking for opportunities on the short side but will continue to respect the fact that this years-long bull market remains intact at least from a technical standpoint. Good luck to all πŸ™‚

~George

george mahfouz jr - Russell 2000