Markets Cheer Fed Rate Hike!

As expected, the Federal Reserve raised short term interest rates by one quarter point and indicated that they will keep raising rates throughout the year albeit gradually. I do think what helped the markets yesterday was the language of only two more rate hikes this year. The economic data coming out so far is stronger than expected including the February jobs report which confirmed how the job market is continuing to expand and this had some pundits thinking three more rate hikes were in the cards for 2017, not just two. Markets rallied once again on the news and quite frankly the market is seemingly rallying on anything that hits the tape. That said, the Federal Reserve is doing a masterful job with how it is handling the change of guard so to speak from accommodation to raising rates and how they are communicating each message.

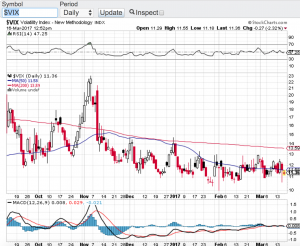
So what does this mean to the markets going forward? I gotta tell you as much as I have been expecting volatility to increase, my expectations now are as long as the Fed remains in its current position, volatility may just stay in hibernation until further notice. I have not seen a market to where vol has been and remains this low. As I write this blog the CBOE Market Volatility Index also know as the VIX remains historically low and even when there is pressure on stocks, the VIX does not move very much, just look at the chart below.

Taking a look at the four major indices, The Dow Jones Industrial Average (chart), the S&P 500 (chart), the Nasdaq (chart) and the small-cap Russell 2000 (chart) all are within striking distance of their record highs. The question now becomes will valuations be able to support the continuation of this bull market or will this be the catalyst to bring pause into this historic bull run. We won’t have to wait too much longer as the first quarter of 2017 winds down and companies prepare to report their earnings results beginning in April. Paula and I wish everyone a very safe and Happy St. Patrick’s Day 🙂

~George

VIX chart - Paula Mahfouz


What A Rollercoaster Ride!

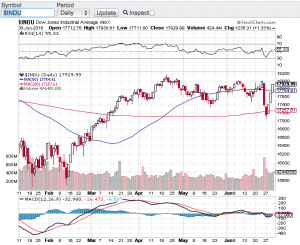
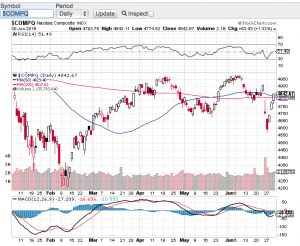
This week started off with the vote no one expected. Global markets were shocked with the outcome of the United Kingdom’s vote to the leave the European Union. Here at home, the Dow Jones Industrial Average (see chart below) lost close to 1,000 points between Monday and Tuesday, the Nasdaq (see chart below) over that same two-day period lost close to seven percent as did the S&P 500 (chart) and the small-cap Russell 2000 (chart). A breathtaking 2-day drop which was so swift and profound that it violated the 200-day moving averages of all of the aforementioned indexes. Fast forward to today and what seemingly was the start of an angry correction, has turned into yet another “buy the dip” opportunity. No matter what the challenges are or have been on the macro-economic or political front, markets over the past several years have shrugged them off. I honestly did not think stocks would snap back this time as quickly and as powerfully as they have.

Yet again, oversold conditions created a trader’s dream with this snap-back rally. Ever since this bull market began, every shocking or unexpected headline which have rattled the markets have always been met with strong support that then turns into the resumption of this protracted bull market. However, it is also very clear that we have been trading in a range for quite some time now and every time we have tried to breakout of this trading range, resistance is met and we retrace back to a variety of moving averages.

So you may be asking how do we break out of this S&P 500 (chart) 2000 to 2120 trading range? One catalyst that can do this is the upcoming second quarter earnings reporting season which kicks off here in July. I do not think that the economy is such that record earnings results will come forward. In fact, companies may take it upon themselves to use the Brexit circumstance to soften their future guidance? We will see. In my humble opinion I think the possibility of a downward break is more probable in the near term than stocks breaking out to all-time highs, especially after this snap back rally. Good luck to all!

Paula and I wish everyone a safe and Happy 4th of July holiday 🙂

~George Mahfouz, Jr.
Dow Jones George Mahfouz JrNasdaq George Mahfouz Jr.

Volatility Wakes Up!

After weeks of tepid volatility (chart)  investors and markets appear a bit jittery with volatility waking up. For the week, the Dow Jones Industrial Average (chart) closed down 1.3%, the tech-focused Nasdaq (chart) closed off 2.7%, the S&P 500 (chart) closed lower by 1.3% and the small-cap Russell 2000 (chart) finished lower on the week by 1.4%. As first quarter earnings reporting season begins to wind down with overall results coming in mixed, we now enter a time of year where weakness in stocks can occur with volatility even more prevalent. The old adage “sell in May and go away” could come into play.

The currents risks to the market as I see it is the market itself as valuations are historically high with the S&P 500 price to earnings ratio trading in the 20’s. Another risk to stocks is the possibility of the Fed raising rates in June.  These catalysts alone could be all that it takes for equities to not only pause but to continue to experience increased volatility as we head into the summer months. So now let’s look at the technical shape of the aforementioned indexes. After trading near or in overbought territory for the past month or so the Dow Jones Industrial Average (chart) broke through its 20-day moving average, the S&P 500 (chart) also broke through its 20-day moving average, however, a bit more troublesome is the Nasdaq (chart)  as it has broke through its 200-day moving average this past week, a moving average that is more closely watched. Finally, the small-cap Russell 2000 (chart) is now sitting right at its 20-day and 200-day moving averages. So the technical shape of the markets at least according to moving averages support lines appear to be breaking down a bit.

So as we head into a typically softer time for equities that is May and June, and considering the current technical shape of the markets, both Paula and I feel it would be best to move to the sidelines and see if the current increase in volatility continues or if this is just a pause in the sharp rally we have seen since the middle of February.

Good luck to all 🙂

~George

Strong Month For Stocks!

Much to my surprise and to the surprise of many investors and traders alike, the major averages in October posted eye-popping results. For the month, the Dow Jones Industrial Average (chart) gained 8.7%, the tech-f0cused Nasdaq (chart) gained almost 10%, the S&P 500 (chart) notched an 8.3% gain and the small-cap Russell 2000 (chart) closed the month out up 5.55%. Yes almost double digit gains for the Dow, Nasdaq and the S&P 500. Now wait a minute, I thought the month of October is supposed to be one of the weakest months of the year for equities. I think in large part earnings reporting season has been a pleasant surprise to most investors and a continuing subdued Federal Reserve is responsible for the most recent gains and confidence in stocks. That said, I do think that this latest market run has been a bit too much too fast.

A quick look at the Relative Strength Index of the aforementioned indexes might also confirm my belief. The relative strength index is also referred to as the RSI. This particular indicator is one of the most watched technical indicators by seasoned traders and investors alike. The RSI compares the size of moves of gains and losses in a given period of time to highlight whether a stock or index is overbought or oversold. According to the RSI principles, the 70 value level or greater is considered an overbought condition and the 30 value level or lower is considered oversold. And as you can see with the Dow Jones Industrial Average (chart), the Nasdaq (chart) and the S&P 500 (chart), all three indexes recently hit or breached their respective 70-value line and reversed course on Friday. Now that does not mean that these indices could not break back through the 70 value level and continue onto higher levels and remain overbought for an extended period of time. What I am saying is that historically and from a technical point of view, the relative strength index has been quite reliable when markets overshoot to the up or down side.

We are now in the final two months of the trading year and let’s see how the markets react to this initial pullback we saw on Friday and whether or not this is the beginning of a slight correction to this extraordinary market run we experienced last month.

Good luck to all 🙂

~George

Nasdaq Closes At A Record High!

Tech stocks have taken off this week due to their strong earnings results. Companies such as Netflix (NasdaqGS: NFLX) soared 18% today after the company reported better than expected subscriber growth. Also today and just after the close, Google (NasdaqGS: GOOGL)  too reported better than expected results with revenue coming in at $14.35 billion compared to $14.26 billion the street was expecting. In after hours trading Google is up over 10% or well over $70.00 per share. Thanks to Google’s earnings results, most other tech companies are also trading up in the after-hours session so it appears that the rally on the Nasdaq (chart) will continue at least through tomorrow.

On a technical note, I want to point to your attention how two of the most influential major averages held their respective 200-day moving averages recently. A little over a week ago the markets were roiled in the Greece debt drama as well as how China’s stock market was falling off a cliff. There was enormous uncertainty as to how Greece and even more so how China’s stock market would play out. This fear and uncertainty sent the Dow Jones Industrial Average (chart) and the S&P 500 (chart)  tumbling down toward and below their 200-day moving averages. It really only took a day for this key support metric to kick in and demonstrate its technical support influence. Since this brief but noticeable selloff occurred, both indices have snapped back and we now find the S&P 500 (chart) within 10 points of its all-time high. Some pundits did indeed expect that Q2 earning reporting season could be the catalyst to lift the markets out of the fears of Greece and China. And seemingly their expectations have been met. That said, there are many more companies set to report their earnings results over the next couple of weeks, with all eyes now focusing on how Apple (NasdaqGS: AAPL) will fare as they are set to report their quarterly report next Tuesday July 21st after the close. As with most earnings reporting seasons over the past few years, stocks have overall fared well and this time it appears well enough to break key index records.

Good luck to all 🙂

~George

Q1 Ends With A Bang!

Stocks closed out the first quarter of the year down impressively. The Dow Jones Industrial Average (chart) closed down 200.19 points, the Nasdaq (chart) -46.55, the S&P 500 (chart) -18.35 and the small-cap Russell 2000 (chart) finished the day down 5.03 points. The Dow Jones Industrials (chart) also finished the quarter slightly in the red, while the other aforementioned indices eked out modest gains.

Looking ahead to Q2, I suspect that we will be in for a very volatile and choppy market. As the first quarter was winding down we were experiencing triple digit swings on the Dow, as well as spikes in volatility across the board. Now I am beginning to think we will even see more volatility come into the market. April historically is a strong month for stocks, but we find ourselves entering into Q1 earnings reporting season in which I think corporate America may see widespread earnings declines. This is due in large part to how strong the U.S. dollar (chart) has been and how this will affect a wide array of multi-national companies who generate meaningful revenues overseas. A strong dollar does not bode well for U.S. companies with this type of earnings profile. Of course not all U.S. companies rely on overseas revenue and I would also think that certain technology and healthcare companies will do just fine.

The one sector I will be paying the closest attention to this upcoming earnings reporting season is the energy sector. Oil (chart) has been taken out to the woodshed since last fall as well as the majority of oil related stocks. So with the price of oil plunging as it has, earnings out of this sector should be horrific. However, these are the times when rare opportunities can and do present themselves. I will look for “washout” moments with certain oil related stocks after they report their earnings to step in and start building positions. I would expect most of the bad news in this sector is about to be released, hence, a set-up for the right buying opportunity. Of course, I will be looking for companies with pristine balances sheets, with minimal to no debt and have those companies at the top of my list. That said, before you make any investments in any sectors, make sure that you consult with a trusted and certified financial advisor(s) to understand the risks associated with stocks, commodities and the like. Also note, this is a holiday shortened trading week due to Good Friday and both Paula and I wish everyone a very safe and happy holiday weekend 🙂

~George

As Expected, New Market Highs Continue…

In my previous blog, I eluded to the notion that the bulls would remain in charge for the foreseeable future and sure enough, in charge they are. Last week, the Dow Jones Industrial Average (chart), the S&P 500 (chart), and the small-cap Russell 2000 (chart) all hit record highs while the Nasdaq (chart) continues to gravitate toward the 5000 level. This market has no quit. With the majority of the S&P 500 companies reporting their Q1 earnings, overall earnings growth was relatively good, topping expectations. Meanwhile, Fed Chair Janet Yellen stated at her biannual meeting with the Senate Banking Committee that the Fed will be patient before any change in interest rate policies and that guidance would be given prior to any such action. This, along with the no real surprises coming out of earnings reporting season and the U.S. labor market showing a continuation of job growth, without question has played a role in the continuing strength of the U.S. stock market.  

Okay, all clear right? Well, we all know there is always the other side to the story and markets do not go up in a straight line forever. Without many upcoming catalysts in March, or in any given time period where catalysts are few, I always refer to the technical shape up of the markets to see if overbought or oversold conditions exist. As you all know by now, one of my favorite technical indicators to gauge whether or not the markets are in extreme conditions, is the Relative Strength Index. If you go back historically and look at the RSI indicator of any given stock or index, you too can see the reliability of this particular indicator when it reaches overbought or oversold conditions. Click on this link to get the definition of the RSINow I am not saying to completely base trading or investment decisions off of this technical indicator or any other technical indicator for that matter. However, for me personally this has proven to be a trusted guide and I do include this analysis when viewing the current market environment. That said, we are beginning to look a little overbought and I am going to look for pullbacks before I entertain any new positions in equities. Good luck to all and I wish all a very prosperous month 🙂

~George

Stocks Go On A Wild Ride!

As the new year begins to unfold, volatility has taken command! Yesterday, the Dow Jones Industrial Average (chart) had a 424 point intraday swing, an intraday move not seen in quite sometime. Volatility continued to surge this morning as stocks opened down sharply by weaker than expected retail sales for the month of December, and JP Morgan (NYSE: JPM) announcing weaker than expected quarterly results. So is this the new norm? Investors and especially traders have been waiting a long time to see volatility come back into the market and they may have just gotten what they have been expecting. For years, stocks have been in a low vol environment thanks in part to the Federal Reserve’s easy monetary policies. Now that those policies have and are winding down, it’s no surprise to me that volatility has picked up. Furthermore, now that we are have entered into Q4 earnings reporting season, I expect that volatility will remain elevated and possibly increase.

Companies that are scheduled to report their earnings results are over the next week are; Citigroup (NYSE: C), Intel (NasdaqGS: INTC), Goldman Sachs (NYSE: GS), Delta Airlines (NYSE: DAL), International Business Machines (NYSE: IBM), Morgan Stanley (NYSE: MS), Netflix (NasdaqGS: NFLX), American Express (NYSE: AXP), eBay Inc. (NasdaqGS: EBAY), Starbucks (NasdaqGS: SBUX), Verizon Communications (NYSE: VZ), General Electric (NYSE: GE), Honeywell International ( NYSE: HON) and McDonald’s Corp (NYSE: MCD) just to name a few.

More now than ever I will be focusing on “top-line” growth of corporate America to see if this most recent sell-off poses a buying opportunity. If the top-line of companies do not begin to grow in a meaningful way, I would expect the selling pressure to continue. Good luck to all 🙂

~George

Once Again, All Eyes On The Fed…

Stocks closed lower last week for the first weekly decline of the broad indices in over a month. The Dow Jones Industrial Average (chart) closed the week down 1%, the Nasdaq (chart) -0.3%, the S&P 500 (chart) closed lower by 1.1% and the small-cap Russell 2000 (chart) also finished the week lower by almost 1%. I suppose a bit of a pullback was overdue considering how much the market has gained over the past five weeks or so. Some of the chatter is that this most recent weakness is due in part to the upcoming Fed policy meeting next week, and the expectation that the Fed is on the brink of changing its language pertaining to interest rates. Between strong economic growth and healthy corporate balance sheets, it’s no wonder analysts are expecting a shift in demeanor over at the Fed. Furthermore, oil has dropped significantly since late June which is finally beginning to show up at the pump. Lower gas prices is a positive for the consumer which could add more fuel to the economy, no pun intended. But wait a minute, the job market recently has done an about face with less hirings occurring in the month of August, which could give the Federal Reserve a reason not to put the brakes on so quickly. Personally, I think the Fed will become a bit more vocal   regarding rising rates over the coming months.

So what could this mean for stocks in the near term? For one, I expect more volatility between now and year end. Especially as it pertains to the upcoming third quarter earnings reporting season. We all know that the Fed will end its asset purchase program in October, and then next logical step for them is to begin to raise interest rates at some point in time. So corporate America sooner than later will have to stand on its own two feet and show top-line growth in order to appease investors and maintain their valuations. See, the accommodative policies over the past five years or so has in part given companies a pass so to speak if they weren’t growing their top-lines. What a lot of companies have done over the past few years is clean up their balance sheets by becoming more efficient by way of trimming expenses and implementing stock buyback programs. This of course in many instances improved their earnings and bottom lines, while not really growing their top-lines. Which is why I view the upcoming Q3 earnings reporting season as potentially one of the defining moments in this historic bull run we have enjoyed over the past five years. This could also be a “Goldilocks” moment where the Fed ends its asset purchase programs, begins to gently raise rates with minimal inflation in sight, and corporate America demonstrates top-line growth. This is what Janet Yellen and the Federal Reserve would call the perfect set-up. I, like most investors would love to see this theme play-out. However, let’s not forget the multi-trillion dollar balance sheet that the Fed has incurred during this unprecedented time of monetary accommodation, and as of now, no one really knows what type of impact this will ultimately have on our economy and our markets. Good luck to all and have a great week 🙂

~George