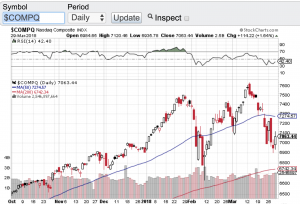
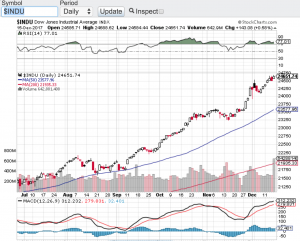
Despite a modest rebound on Friday tech stocks remain under fire. From Facebook (NasdaqGS: FB) to Tesla (NasdaqGS: TSLA) and now even Amazon (NasdaqGS: AMZN) are all under pressure for a variety of reasons. This is spilling over into the overall tech sector (see chart below) and even into the overall marketplace. Facebook is facing significant scrutiny regarding user privacy while Tesla continues to trip up with deliveries and debt issues and now even Amazon is under pressure due to President Trump’s direct attack on the online retailer’s sales tax structure. This was enough to send the major averages down to close out the quarter at or in negative territory. The Dow Jones Industrial Average (chart) finished Q1at 24103, the S&P 500 (chart) closed the quarter at 2640, the Nasdaq Composite (chart) closed at 7063 and the small-cap Russell 2000 (chart) finished the first quarter of the year at 1529.
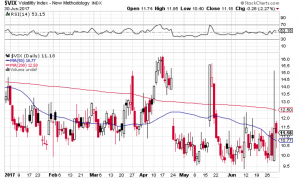
What was also obvious in Q1 was how volatility came back to life. For years the market was in a lullaby state melting up and setting record after record. Well the first quarter has swiftly reminded us on how markets can and should behave. Investors that placed money into mutual funds or passive funds over the past several years made out like a bandit with not a worry in the world. Abnormal stock market gains were in vogue especially after the election. Now with rising interest rates, the Federal Reserve reducing its debt load and the daily drama out of Washington DC, I think it is safe to say the melt up mode and daily records being set are in the rear view mirror. That said, market corrections are very normal and healthy and so is volatility at least for traders that is 🙂
Looking ahead and with earnings reporting season right around the corner, let’s see how corporate America fared in the first quarter of the year. This could be the catalyst that calms things down a bit but in the same breath should there be any slippage in earnings growth, we could be in for more even more volatility. Good luck to all 🙂
~George