As we enter into Q1 earnings reporting season there are risks abound! Whether it’s the brewing trade war with China, rising interest rates here at home or geopolitical tensions in the middle east, the risk profile of this market has certainly increased in recent weeks. Money center banks such as JP Morgan Chase (NYSE: JPM), Citigroup (NYSE: C) and Wells Fargo (NYSE: WFC) kicked off earnings reporting season and all reported solid earnings numbers only to see their stocks falter on Friday. So we could be setting up for a better than expected earnings reporting season and the markets won’t care due to the aformentioned risks that are present. We will certainly find out this upcoming week as hundreds of companies are set to report their quarterly results. We kick off the week with earnings from Bank of America (NYSE: BAC), Charles Schwab Corp (NYSE: SCHW), Netflix (NasdaqGS: NFLX) followed by Goldman Sachs (NYSE: GS), Johnson & Johnson (NYSE: JNJ), Intuitive Surgical (NasdaqGS: ISRG), United Continental Holdings (NYSE: UAL), United Healthgroup (NYSE: UNH), Abbot Labs (NYSE: ABT), American Express (NYSE: AXP), Morgan Stanley (NYSE: MS), United Rentals (NYSE: URI), Etrade Financial Corp. (NasdaqGS: ETFC), General Electric (NYSE: GE) Honeywell International (NYSE: HON), Procter & Gamble (NYSE: PG), Schlumberger (NYSE: SLB) and Transunion (NYSE: TRU) just to name a few.
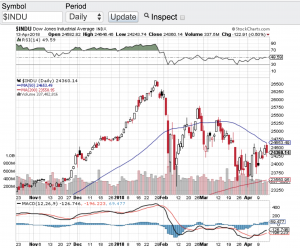
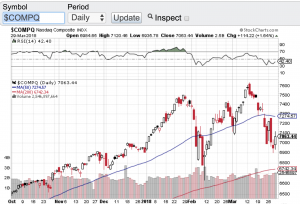
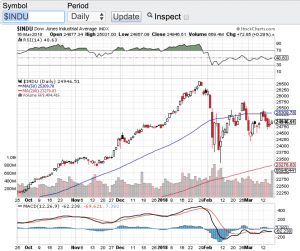
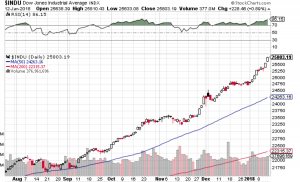
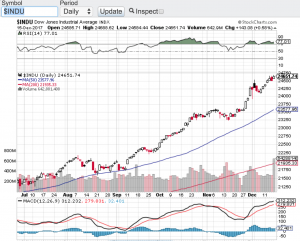
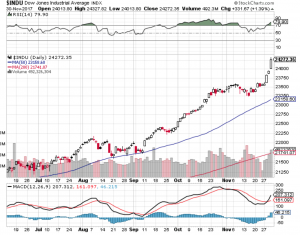
Let’s take a gander at the technical shape of the markets. The Dow Jones Industrial Average (see chart below) has bounced off of its 200-day moving average multiple times over the past couple of weeks and is now hovering at its 20-day, the same can be said for the S&P 500 (chart), the Nasdaq Composite (chart) is right on its 20-day and 100-day moving averages as is the small-cap Russell 2000 (chart). So all of the key indices are at or slightly above key support levels and just maybe between earnings reporting season and key support levels in play, stocks can withstand the risks that are currently present. Good luck to all 🙂
~George